July 2026 Forecast for the U.S. and Canada: Super El Niño, Heat, Monsoon Floods and Wildfire Risk
July 2026 may become one of the most weather-sensitive months of the year for North America. A rapidly strengthening El Niño is now underway in the tropical Pacific, NASA satellites are tracking warm water building below the ocean surface, and North American seasonal models are sending a clear message: the United States and Canada should prepare for a July shaped by heat, regional drought, wildfire danger, monsoon storms, heavy-rain pockets and a split pattern between the West, the South, the Great Lakes and Canada’s northern regions.
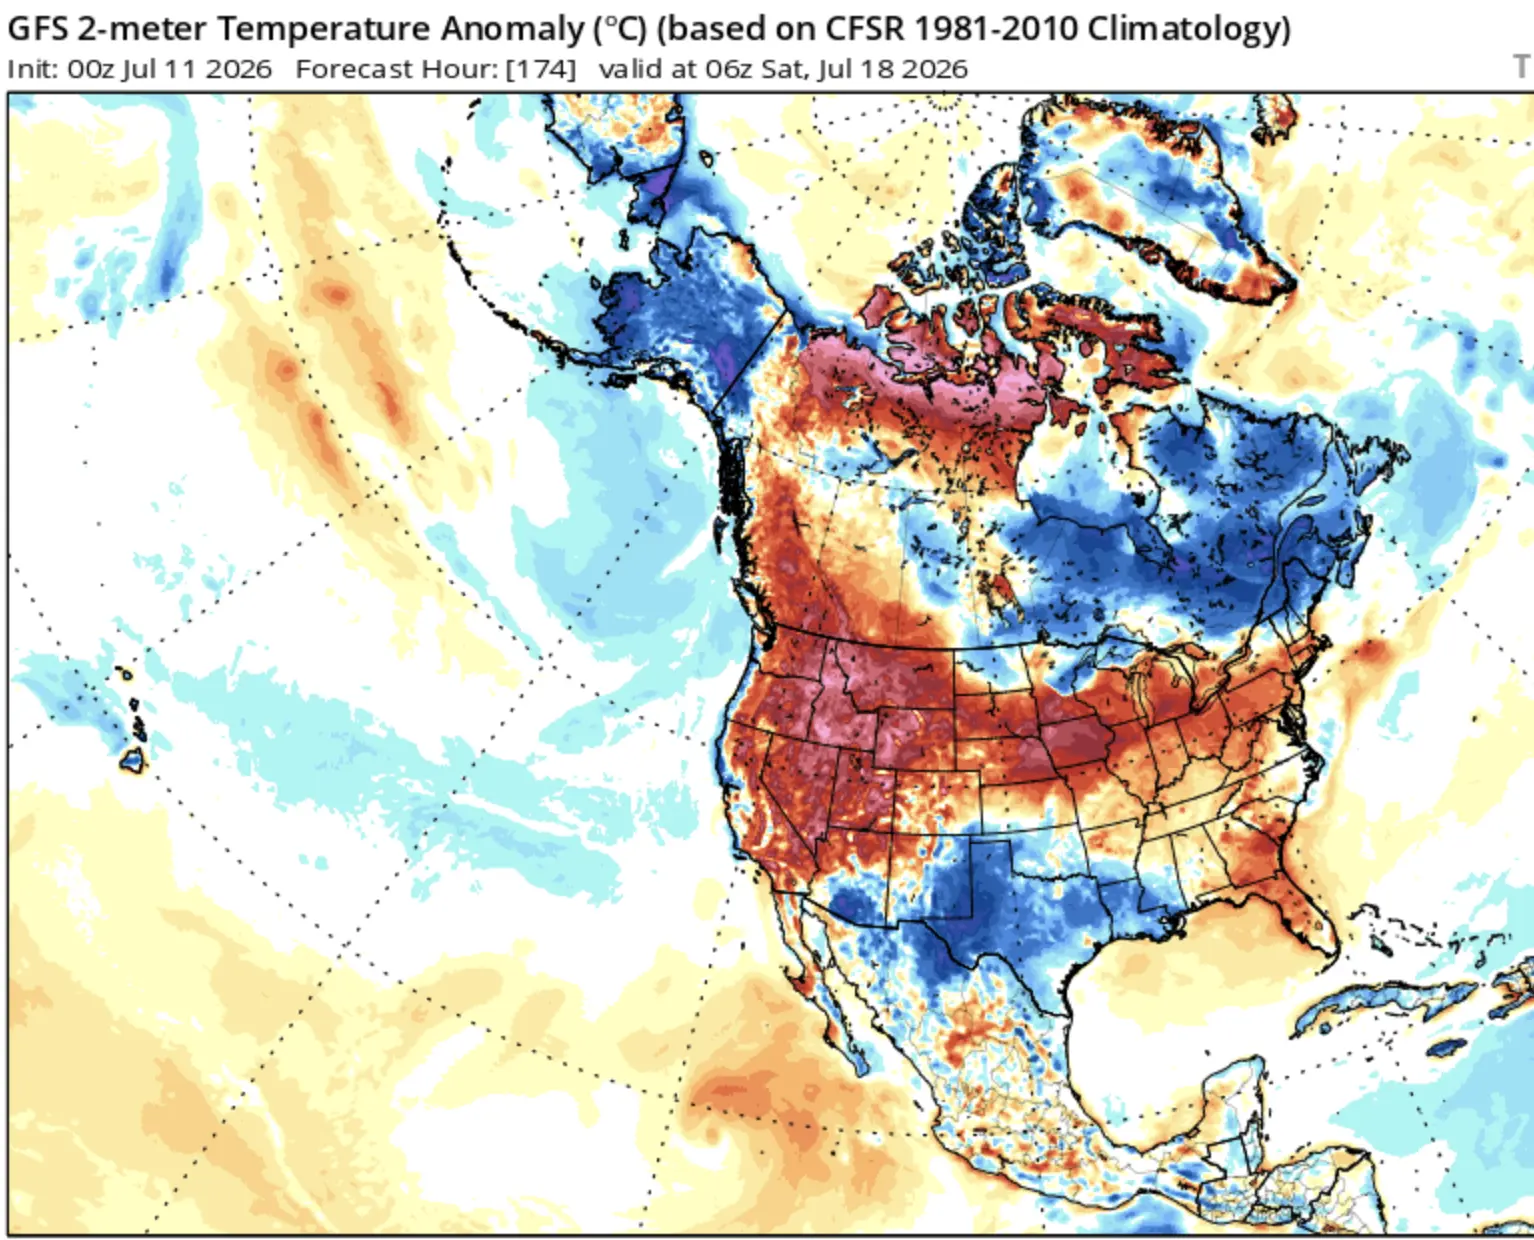
The main July signal is heat. NOAA favors above-normal temperatures across much of the western U.S., the southern tier and the East Coast, with the strongest probabilities over the Interior West. Canada’s seasonal system also supports a warmer-than-normal summer background across large parts of the country. But July will not be hot in the same way everywhere: the Southwest and Rockies may get more monsoon rainfall, the Pacific Northwest and Northern California face drought development, the Ohio and Tennessee valleys may stay stormier, and Canada’s wildfire-sensitive provinces need to watch heat, lightning and dry spells closely.
This is a long-range July outlook, not a daily forecast. Seasonal models show probability and risk zones. They cannot tell you the exact hour of a heat dome, derecho, flood, wildfire outbreak or tropical storm. The most useful forecast is the pattern: where heat, dryness, moisture and storm tracks are most likely to line up.
The headline: El Niño is here, and the July pattern is already responding
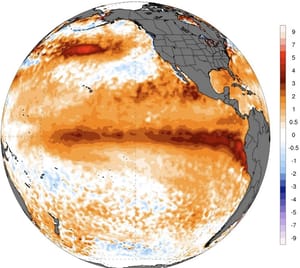
El Niño conditions developed in June 2026 and are expected to strengthen toward winter. NOAA’s official discussion says El Niño is present and likely to intensify into the Northern Hemisphere winter. The most dramatic signal is not only the surface water warming, but the deeper ocean heat reservoir seen by satellite and ocean analyses.
NASA’s Sentinel-6 Michael Freilich satellite has observed higher-than-normal sea surfaces across the central and eastern tropical Pacific. That matters because warm water expands, raising sea level and revealing where heat is stored below the surface. This is why the 2026 El Niño is being watched so closely: it is still building, and the ocean appears to be loading the atmosphere for a stronger autumn and winter response.
For July, the key point is more subtle. El Niño is active, but its full North American impact is usually stronger in autumn and winter than in midsummer. That means July 2026 is not a pure “Super El Niño weather map.” It is a mixed summer pattern: El Niño influence, hot land surfaces, dry soils, monsoon shifts, decadal warming trends and model agreement all pulling together in some regions and fighting each other in others.
What the American and Canadian models say
Model consensus: July favors heat across the western U.S., southern U.S. and East Coast; wetter signals are stronger from the Southwest into the Rockies and parts of the Ohio / Tennessee / Middle Mississippi valleys; Canada leans warmer than normal in many regions, but rainfall confidence is lower and wildfire risk depends on dry spells, lightning and wind.
Model / source
What it is best for
July 2026 signal
Confidence
NOAA CPC 30-day outlook
Official U.S. July temperature and precipitation probabilities
Warmer odds over the West, southern tier and East Coast; wetter Southwest / Rockies; drier Pacific Northwest and North-Central U.S.
High for broad U.S. pattern, lower for exact local rainfall
NOAA CPC JAS seasonal outlook
July–August–September background pattern
Above-normal temperatures favored over much of the West, Southeast and East Coast; wetter western U.S. signal expands with El Niño influence
Moderate to high
NMME
Multi-model North American seasonal forecast system
Supports major warm signal over the western U.S. and strong developing El Niño in the tropical Pacific
Moderate to high where models agree
CFSv2
NOAA/NCEP coupled seasonal model
Useful input for monthly anomalies, but not the official forecast by itself
Moderate; can fluctuate run to run
GEFS / Week 3–4 guidance
Early July pattern support
Helps confirm short-lead July heat and rainfall corridors
Moderate for Weeks 3–4, lower later in July
CanSIPS / Environment Canada
Official Canadian probabilistic seasonal guidance
Warmer-than-normal summer background across much of Canada, with regional rainfall uncertainty
Moderate; best for broad tercile probabilities
NASA Sentinel-6 / JPL
Ocean heat and El Niño precursor monitoring
Confirms warm water buildup and sea-level anomalies in the equatorial Pacific
High for observed ocean state, not a local July weather forecast
United States July 2026: the national picture
The United States is split into three major July stories. First, the West and Interior West face strong heat probabilities, with drought and fire-weather concerns in the Pacific Northwest and Northern California. Second, the Southwest and the Rockies may see a more active monsoon signal, meaning flash-flood risk can sit next to heat and drought. Third, the South and East Coast remain hotter than normal, while the Great Lakes and parts of the central U.S. are more uncertain and may avoid the worst persistent heat.
The most dangerous July weather will likely come from extremes colliding: heat plus dry soil in the West, heat plus humidity in the South and East, monsoon storms over burn scars in the Southwest, and severe thunderstorm corridors around the Ohio and Tennessee valleys.
U.S. regional forecast for July 2026
Region
Temperature outlook
Precipitation outlook
Main July risk
Most exposed areas
Pacific Northwest
Above-normal temperatures favored
Below-normal precipitation risk
Drought development, wildfire danger, heat stress
Washington, Oregon, northern Idaho, western Montana
Northern California
Hotter-than-normal risk
Drier-than-normal tendency
Wildfire danger, dry vegetation, water stress
Northern California, Sierra foothills, interior valleys
Interior West
Strongest above-normal temperature signal
Mixed; storms possible in mountain corridors
Heat dome episodes, fire weather, dry lightning
Nevada, Utah, Idaho, Wyoming, interior Oregon, interior Washington
Southwest
Above-normal temperatures still possible, but storm-cooled periods likely
Above-normal temperatures favored toward the coast
Slight wet tilt along parts of the Mid-Atlantic / Northeast coast
Humidity, urban heat, heavy rain, thunderstorm clusters
New York City, Philadelphia, Boston, Washington, D.C., coastal New England
Alaska
Weak above-normal temperature tilt for many interior and southeast areas
Northwest Alaska and Aleutians lean wetter
Wildfire risk inland, river flooding pockets, coastal storminess
Interior Alaska, western Alaska, Aleutians, Southeast Alaska
The West: heat, drought and wildfire danger
The western U.S. is the hottest headline zone for July. NOAA’s official outlook highlights the Interior West with the strongest odds of above-normal temperatures. That is the classic setup for heat domes, wildfire growth, strained reservoirs, smoke episodes and power demand spikes.
The Pacific Northwest and Northern California need special attention because drought development is expected during the July–September period. A dry July in these regions can quickly raise fire danger, especially if lightning arrives without widespread soaking rain.
Western wildfire risk is not just about the thermometer. The dangerous combination is heat, low humidity, wind, dry fuels and lightning. July can become explosive when vegetation dries early and then storms bring wind without enough rain.
The Southwest: monsoon relief or flash-flood trap?
The Southwest has a different July story. NOAA favors wetter conditions from the Southwest into the Intermountain West and Central / Southern Rockies. That can be good news for drought relief, but it also raises flash-flood danger.
Arizona, New Mexico, Colorado, Utah and parts of West Texas may see a July pattern where one valley is flooding while another remains dry and hot. Burn scars, slot canyons, desert washes, dry riverbeds and mountain roads become especially dangerous when monsoon storms fire quickly in the afternoon.
The South and East: heat index becomes the real number
Across the Gulf Coast, Southeast and East Coast, July’s danger is not just the air temperature. It is the heat index. High humidity can make a 95°F day feel far more dangerous, especially in cities, outdoor job sites and neighborhoods with limited cooling.
The East Coast and coastal Gulf states are favored for above-normal temperatures. The Mid-Atlantic and Northeast may also face heavy-rain episodes if storm clusters ride the boundary between hot air and cooler northern air.
Canada July 2026: warmer background, wildfire watch and regional contrasts
Canada’s July outlook is warmer than a typical summer baseline across many regions, but not uniformly dry. CanSIPS guidance should be read as probabilities rather than fixed city forecasts. The highest practical concerns are heat in western and central provinces, wildfire danger in forest zones, storm bursts over the Prairies, and a more humid, storm-prone pattern from Ontario into Quebec and Atlantic Canada.
Canada’s official seasonal system is designed for long-range probabilities. That means July should be treated as a risk map: where warmth is more likely, where dryness could persist, and where storms may interrupt heat. The strongest danger is when warm anomalies overlap with dry forest fuels, lightning and wind.
Canada regional forecast for July 2026
ManitobaWarm with storm interruptionsThunderstorm corridors possibleSevere storms, heavy rain pockets, heat and humidityWinnipeg, Brandon, Interlake, southern Manitoba
Canadian region
Temperature outlook
Precipitation outlook
Main July risk
Most exposed areas
British Columbia
Warmer-than-normal risk, especially interior valleys
Mixed; coastal moderation, interior dry spells possible
Calgary, Edmonton, Peace region, foothills, southern Alberta
Saskatchewan
Warm to hot spells likely
Storm-dependent rainfall
Drought stress, hail, severe storms, grass fires
Regina, Saskatoon, southern and central Saskatchewan
Ontario
Warmer than normal risk, especially southern and eastern areas
Stormy periods possible
Heat index, severe storms, urban flooding, smoke intrusions
Toronto, Ottawa, Windsor, London, Hamilton, Thunder Bay
Quebec
Warm and humid periods likely
Storm-dependent rainfall
Heat waves, severe storms, wildfire smoke, heavy rain
Montreal, Quebec City, Gatineau, Saguenay, Abitibi
Atlantic Canada
Near to warmer-than-normal inland; coastal moderation
More variable, fog and storm systems possible
Humidity, heavy rain, tropical-remnant risk later in season
New Brunswick, Nova Scotia, PEI, Newfoundland
Northern Canada
Warmer-than-normal risk in many areas
Variable
Wildfires, smoke, permafrost / infrastructure stress, river impacts
Yukon, Northwest Territories, Nunavut forest-edge zones
Model comparison: where they agree and where they fight
The model story is not perfectly clean, but several signals are strong enough to build a practical July outlook. The warm West signal is the clearest. The wetter Southwest / Rockies signal is also meaningful. The central U.S. and Great Lakes are more uncertain, and Canada’s rainfall pattern has lower confidence than temperature.
Forecast question
NOAA CPC
CFSv2
NMME / C3S
CanSIPS
Best interpretation
Will July be hotter than normal in the western U.S.?
Yes, strong signal
Generally supportive
Supportive
Not U.S.-official, but North American warmth signal supportive
High confidence: West and Interior West are the main heat zones
Will the Southwest be wetter?
Yes, elevated odds
Supportive in many runs
Supportive enough for official outlook
Indirect relevance
Moderate confidence: monsoon storms and flash-flood risk elevated
Will the Pacific Northwest dry out?
Dry tilt and drought development risk
Generally supportive
Supportive
Similar concern for western Canada dry spells
Moderate to high confidence: wildfire risk grows
Will the Great Lakes be hot?
Equal chances in many areas
Mixed
Mixed
Ontario / Quebec warm risk, but stormy interruptions
Lower confidence: expect swings, storms and humidity rather than a simple heat dome
Will Canada be warmer than normal?
Not Canada-specific
North American warmth signal supports parts of Canada
Broad warm North American tendency
Official Canadian probabilistic system supports warmer seasonal background
Moderate confidence: warm summer risk, especially west / interior / central areas
Will El Niño dominate July?
Minor direct influence in July
Shows strengthening ocean signal
Shows strong developing El Niño
Accounts for global coupled signal
El Niño is important, but July remains driven by heat, soil moisture, monsoon and storm tracks
Super El Niño: real signal, careful wording
“Super El Niño” is the phrase media will use if the Pacific keeps warming rapidly. Official agencies are more careful. NOAA says there is a high chance of a very strong El Niño later in 2026, while NASA data show warm water building and more Kelvin-wave activity heading east across the Pacific.
The practical July message is this: the atmosphere is already responding, but the biggest El Niño impacts for North America are more likely to mature in late summer, autumn and winter. July is the bridge month. It may not look like a textbook El Niño winter, but it can still carry early fingerprints: a more active Southwest monsoon, changing Pacific storm behavior, suppressed Atlantic hurricane activity compared with hyperactive seasons, and increased eastern Pacific tropical risk.
El Niño often increases wind shear over the Atlantic, which can suppress tropical cyclone development. NOAA’s 2026 Atlantic hurricane outlook leans below normal. That does not make the Gulf Coast or East Coast safe: one landfall can still be damaging, and July can still bring tropical downpours, stalled fronts and flooding without a major hurricane.
The eastern Pacific is a different story. NOAA’s eastern North Pacific hurricane outlook notes that El Niño conditions tend to support more activity in the eastern and central Pacific. This matters for Mexico, the Southwest U.S., California moisture surges and western North America’s late-summer rainfall pattern.
July hazards: what can go wrong fast
Hazard
U.S. risk zones
Canada risk zones
Trigger
Heat dome
Interior West, Pacific Northwest, Texas, Gulf Coast, Southeast, East Coast
Interior B.C., Prairies, southern Ontario / Quebec during hot spells
Strong high pressure, dry soils, stagnant air
Wildfire danger
Pacific Northwest, Northern California, Great Basin, Rockies
Pattern may wobble; central U.S. storms and Ohio / Tennessee Valley rainfall remain important
Storm breaks possible across Prairies and Ontario / Quebec
Severe storms and heavy-rain pockets
July 22–31
Late-month heat may return in waves; West remains fire-sensitive
Wildfire danger depends on rainfall coverage; warm nights more important in cities
Renewed heat, smoke, tropical moisture surges
Bottom line for the United States
The U.S. July pattern has three headline risks. The West is the heat-and-fire zone. The Southwest and Rockies are the monsoon flood zone. The South and East are the heat-index zone, where humidity can make conditions dangerous even when the thermometer does not break records.
The most stable warm signal is in the Interior West and western CONUS. The strongest precipitation signal is wetter-than-normal risk from the Southwest into the Rockies, with stormier corridors toward the Ohio and Tennessee valleys. The central northern U.S. and Great Lakes remain more uncertain.
Bottom line for Canada
Canada’s July is likely to lean warmer than a typical summer baseline, but rainfall will decide the real hazard. If storms arrive often enough, parts of the Prairies and Ontario / Quebec can avoid the worst drought stress. If storms miss repeatedly, wildfire danger can climb fast.
British Columbia, Alberta, Saskatchewan and the Northwest Territories should watch fire weather closely. Southern Ontario and Quebec should watch heat and humidity. Atlantic Canada may be less extreme than the continental interior, but tropical moisture and heavy-rain systems become more important later in summer.
Pogodnik app
Before travel, outdoor work, wildfire-season trips or storm days across North America, check heat, rain, wind and local weather changes in the Pogodnik app. Track hourly weather, temperature, precipitation, wind and cloud cover for your location. Download the Pogodnik Android app: https://play.google.com/store/apps/details?id=com.bitltd.pogodnik
Main takeaway
July 2026 is not just another summer month for the U.S. and Canada. The Pacific is loading toward a potentially very strong El Niño, NASA satellites are watching warm ocean waves stack up, and NOAA / Canadian seasonal systems are already highlighting a hot, uneven and risk-heavy pattern across North America.
The most likely story: a hotter West, a stormier Southwest monsoon, wildfire and drought pressure in the Pacific Northwest and Northern California, humid heat across the South and East, and a warmer but highly variable Canada. July may not yet deliver the full force of Super El Niño, but it may be the month when North America starts to feel the first clear edges of it.
FAQ: July 2026 U.S. and Canada forecast
Will July 2026 be hotter than normal in the United States?
Above-normal temperatures are favored across much of the West, the southern tier and the East Coast. The strongest heat signal is over the Interior West.
Which U.S. regions face the biggest wildfire risk?
The Pacific Northwest, Northern California, Great Basin, Rockies and parts of the Interior West face the highest fire-weather concern if heat and dry fuels align.
Will the Southwest monsoon be active?
Yes, the July outlook favors wetter conditions from the Southwest into the Rockies. That can help drought in some areas but also raises flash-flood risk.
Is Canada expected to be hotter than normal?
Many parts of Canada lean warmer than normal in the seasonal background, especially western and interior regions. The exact risk depends on rainfall and storm frequency.
What does NASA data say about El Niño?
NASA’s Sentinel-6 satellite observed higher-than-normal sea surfaces in the central and eastern equatorial Pacific, which indicates warmer water and ocean heat buildup associated with El Niño.
Is this already a Super El Niño?
Official agencies describe the event as El Niño with a significant chance of becoming very strong later in 2026. “Super El Niño” is a media label for a very strong event, not the preferred operational term.
Will El Niño reduce Atlantic hurricanes?
El Niño often increases wind shear over the Atlantic, and NOAA’s 2026 Atlantic outlook leans below normal. But coastal risk remains because one storm can still cause major impacts.
Sources and methodology
This article uses NOAA CPC July 2026 and July–September 2026 outlook discussions, NOAA ENSO Diagnostic Discussion, NOAA CFSv2 seasonal model guidance, NMME model documentation, Environment Canada / CanSIPS seasonal forecast information, NASA Earth Observatory and JPL Sentinel-6 El Niño observations, WMO seasonal climate updates, NOAA hurricane outlooks and drought information. The forecast is scenario-based and should be updated with weekly NOAA CPC outlooks, Environment Canada alerts, NWS local forecasts, wildfire outlooks and short-range severe-weather guidance.
The Founder and Chief Meteorologist at Pogodnik.com. With over 15 years of operational experience in synoptic analysis and climate forecasting, he specializes in storm tracking, magnetic storms, and atmospheric dynamics. A recognized expert in Ukraine’s meteorological sector, he maintains strategic collaborations with global agencies, including NOAA and ECMWF, to ensure high-precision data integration. His analytical reviews and scientific contributions are regularly featured in leading media outlets dedicated to weather science and environmental trends.