

How the global fire map works
The interactive map combines NASA FIRMS active fire detections, Fire Radiative Power (FRP), and near-surface wind fields. It supports situational awareness but does not replace local emergency information.
NASA FIRMS satellite observations
Satellite instruments detect thermal anomalies. New points appear after each observation is processed, so the data are near real time rather than a continuous live feed.
Intensity and FRP
FRP measures radiative power in megawatts. On this map: low is below 20 MW, moderate is 20–99.9 MW, high is 100–499.9 MW, and extreme is 500 MW or more.
Wind at 10 metres
The animation uses Open-Meteo near-surface wind fields. It indicates airflow direction but is not a forecast of fire spread or smoke movement.
Map limitations
Cloud, smoke, and satellite overpass timing can affect detection. Industrial sites, gas flares, and other hot surfaces may sometimes appear as possible fire detections.
What the global fire map shows
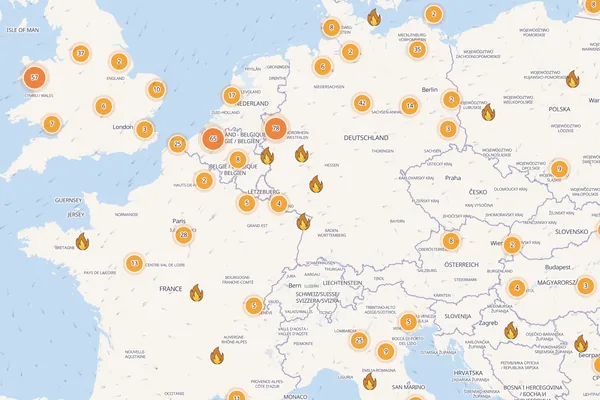
The map displays satellite-detected thermal anomalies around the world. It is a snapshot of activity at the time of a satellite overpass, not a continuous video feed. A marker identifies a pixel where an algorithm detected unusually high temperature. It does not show the exact fire perimeter, the total burned area, or the boundary of a wildfire.
A cluster number represents the available detections in that area at the current zoom level. Zooming in separates the cluster into individual observations. Several satellite observations may relate to the same incident, so the number of markers should not be interpreted as the number of distinct fires.
How to use the interactive map
Pan and zoom to examine a country or region. Select a cluster to move closer, then select an individual fire icon to view coordinates, detection time in UTC, and FRP. Coordinates can be copied, but they should be checked against official local information before they are used for navigation, emergency planning, or any safety decision.
The intensity filter hides detections outside the selected FRP range. The wind button enables or disables the modelled near-surface wind field. Fullscreen mode provides more room for map exploration, while the links above and below the map offer a direct route to the data explanation and back to the map.
Where NASA FIRMS data come from
NASA FIRMS distributes fire and thermal-anomaly observations from MODIS instruments aboard Terra and Aqua and VIIRS instruments aboard Suomi NPP, NOAA-20, and NOAA-21. NASA lists an approximate global spatial resolution of 1 kilometre for MODIS active-fire products and 375 metres for VIIRS products. The finer VIIRS resolution improves the response to relatively small hot areas.
Global FIRMS products are described as near real time, with NASA generally listing availability within three hours of observation. This is not a Pogodnik delivery guarantee: processing, import, network conditions, and page refreshes may add delay. This map also does not expose the sensor name for each marker, so the icon size must not be used to infer the physical size of a fire.
What satellite detection and FRP mean
The technical term “thermal hotspot” means that a satellite algorithm identified a thermal anomaly within a pixel. It often represents active burning, but industrial heat sources, gas flares, volcanic activity, or other hot surfaces can also produce detections. It is therefore more accurate to call a marker a satellite detection until an event has been confirmed by an official authority.
FRP means Fire Radiative Power and estimates radiative energy in megawatts. It helps compare observations, but it is not the burned area and it is not a public danger scale. The ranges used here—low below 20 MW, moderate from 20 to 99.9, high from 100 to 499.9, and extreme from 500 MW—are Pogodnik interface groups, not official NASA threat categories.
Accuracy and satellite-detection limits
Detection depends on satellite overpass time, cloud conditions, surface characteristics, thermal-signal strength, and the quality of the source observation. A coordinate normally represents the centre of a flagged pixel and may not match the exact ignition point. One marker does not mean that the entire pixel is burning.
The absence of a marker does not prove that there is no fire. An incident may have started after the latest overpass, may be too small or short-lived, or may be obscured by observation conditions. Linear or unusually dense patterns can occasionally result from anomalous satellite data. Use official alerts for evacuation, route planning, and threat assessment.
Fire, wind, and safety
The wind animation uses Open-Meteo model data at the standard level of 10 metres above the surface. It helps illustrate the broad airflow direction over the selected area, but it is not a direct measurement beside each detected fire. Terrain, buildings, vegetation, gusts, and local circulation can differ substantially from the large-scale model field.
Wind direction on this map must not be used as a standalone forecast of fire spread or smoke movement. Such forecasts require fuel moisture, terrain, precipitation, atmospheric stability, and other inputs. If there is an immediate local threat, leave the danger area according to official instructions and contact the appropriate emergency service.
If there is an immediate threat, follow official warnings and contact your local emergency services.
Data sources: NASA FIRMS, Open-Meteo, VersaTiles.
Back to the map