Super El Niño 2026/27 Is Surging: NOAA Gives 81% Odds of a Very Strong Peak
The 2026 Super El Niño forecast is becoming more serious by the month. By mid-August 2026, El Niño is already established and rapidly strengthening. The key signal is not one dramatic forecast map, but the fact that the tropical Pacific Ocean and the atmosphere are changing together: sea-surface temperatures are rising, trade winds are weakening, a large pool of heat is moving east below the surface, and major seasonal forecast systems increasingly favor a very strong peak late in 2026.
El Niño forecast 2026/27 — the key points:
NOAA: an El Niño Advisory is in effect.
RONI: the index moved from −0.9°C in winter to +1.0°C by May–July, showing an unusually fast transition from La Niña.
81%: NOAA gives an 81% probability of a very strong El Niño during October–December 2026.
IRI: its July ensemble shows near-total confidence that El Niño persists into early 2027.
ECMWF: strongly supports a warm tropical Pacific, although the exact peak intensity remains uncertain.
United States: the odds increase for a stronger southern storm track and wetter conditions across parts of the South and East.
Canada: a milder winter circulation becomes more likely across large areas.
Europe: the connection is less direct, but current seasonal models lean toward a milder, more Atlantic-driven winter overall.
Important: a very strong El Niño has substantial official support. But “Super El Niño” is not an official NOAA category, and a record-strength event is still a high-end forecast scenario rather than an established fact.
2026 Super El Niño Forecast: From La Niña to El Niño in Less Than Six Months
Official NOAA Climate Prediction Center data show how quickly the tropical Pacific has changed. The Relative Oceanic Niño Index, or RONI, adjusts the traditional Niño 3.4 measurement for the broader warming of the tropical oceans. That makes it more useful when comparing modern El Niño events with older ones.
Simple analogy: imagine measuring one hot room inside a building that has already warmed overall. A traditional index tells you how hot that one room is. RONI also accounts for the fact that the whole building — the tropical ocean — has become warmer.
Three-month period
RONI 2026
December — January — February
−0.9°C
January — February — March
−0.8°C
February — March — April
−0.4°C
March — April — May
0.0°C
April — May — June
+0.5°C
May — June — July
+1.0°C
In just a few overlapping seasons, the index climbed from about −0.9°C to +1.0°C. This is more than a simple move through neutral conditions — it is a rapid reversal of the entire ocean-atmosphere system.
Source: NOAA Climate Prediction Center, Relative Oceanic Niño Index (RONI), ERSSTv6 dataset.
NOAA notes that the latest RONI values can still be revised slightly. But the direction is clear: La Niña has ended, El Niño has formed, and the event is strengthening quickly.
El Niño Ocean Temperature Anomaly: Why the Pacific Signal Matters
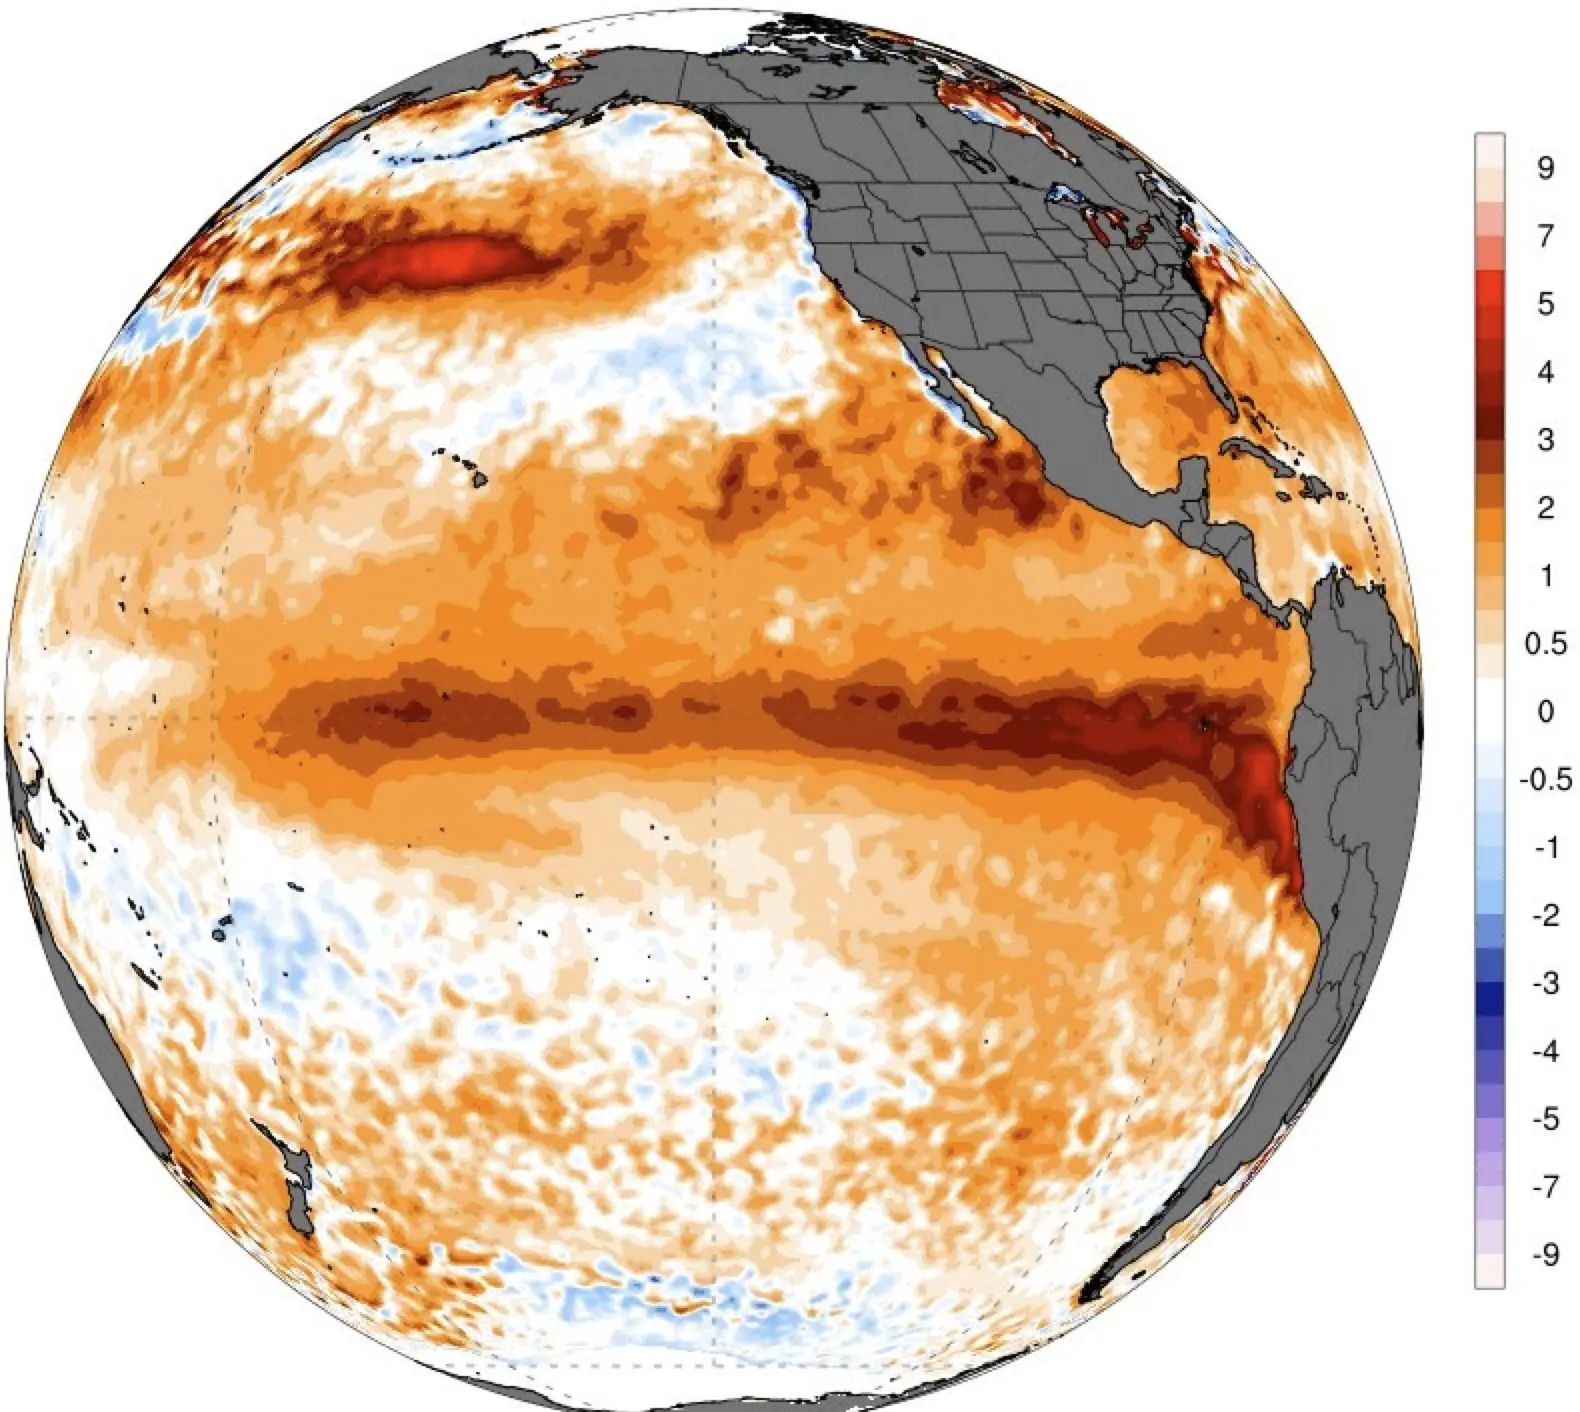
The El Niño ocean temperature anomaly is one of the clearest ways to track how rapidly the event is developing. By mid-July, sea-surface temperature anomalies were around +2.6°C in Niño 1+2, +1.7°C in Niño 3, and about +1.3°C in Niño 3.4.
But the ocean temperature anomaly alone is not enough. The atmosphere is responding too: convection has weakened over Indonesia while strengthening over the central and east-central tropical Pacific.
What is convection? It is the upward movement of warm, moist air. As the air rises, it cools, clouds form, and rain or thunderstorms can develop. Think of a pot of boiling water: warmer water rises while cooler water sinks. The atmosphere behaves in a similar way, only with air instead of water.
Another simple analogy: a warm ocean is like a heated stovetop. For El Niño to influence weather around the world, the atmosphere has to “switch on the fan” and reorganize the large-scale airflow above it. That atmospheric response is already visible.
Why El Niño 2026 Is Strengthening So Fast
One major mechanism is a series of westerly wind bursts. Under normal conditions, tropical trade winds blow from east to west along the equator and continually push warm surface water toward the western Pacific.
What are trade winds? They are persistent tropical winds that usually blow in the same general direction. Imagine a long conveyor belt steadily pushing warm surface water across the ocean. When that conveyor slows down, warm water can move back toward the east.
When the trade winds weaken or temporarily reverse, part of the stored warm water begins moving east below the surface.
Simple analogy: imagine a bathtub where a fan constantly pushes warm water toward one end. If the fan weakens or reverses, the water starts flowing back. That is similar to what happens when the Pacific trade winds weaken during a developing El Niño.
Below the surface, a downwelling Kelvin wave carries a huge volume of warm water from the western Pacific toward the central and eastern basin.
What is a Kelvin wave? The easiest way to picture it is as a slow underwater conveyor belt of heat. It transports a large “package” of warm water thousands of miles eastward. As that heat rises closer to the surface, it can help El Niño strengthen further.
According to the cited meteorological analysis, subsurface temperature anomalies in the core of this warm-water wave exceed +9°C at some depths. That represents a large reservoir of heat that may continue feeding surface warming into autumn.
El Niño Forecast: Seasonal Models Now Favor a Very Strong Event
The strongest argument for the current El Niño forecast is not any single model. It is the agreement among several independent forecast systems.
What is a model ensemble? Instead of making one forecast, scientists run dozens of forecasts with slightly different starting conditions. It is like asking dozens of independent forecasters the same question. If most reach a similar answer, confidence in the overall scenario increases.
In NOAA’s July strength table, the probability of a very strong El Niño during October–December 2026 was 81%. The probability was 75% for November–January and 54% for December–February 2026/27.
Period
Probability of very strong El Niño
October — November — December 2026
81%
November — December — January
75%
December — January — February 2026/27
54%
The North American Multi-Model Ensemble (NMME) also expects El Niño to strengthen further toward the end of 2026.
The International Research Institute for Climate and Society (IRI) showed near-total confidence in its July ensemble that El Niño would persist into early 2027.
The European Centre for Medium-Range Weather Forecasts (ECMWF) also supports a very warm tropical Pacific, but the exact peak intensity still has a wide range.
What does model spread mean? Imagine every forecaster agrees winter will be warmer than normal, but one says by 1°C and another says by 3°C. The direction is clear, but the exact magnitude is not. That is the situation with the current El Niño forecast: models broadly agree on a powerful event but disagree on exactly how powerful the peak will be.
Some ECMWF ensemble scenarios have placed the autumn Niño 3.4 anomaly roughly between +1.7°C and +3.3°C. That supports a strong to very strong event, but it does not guarantee a record.
Can We Already Call It a Super El Niño?
Super El Niño is not an official NOAA category. The phrase is commonly used for the most extreme historical events, such as 1982/83, 1997/98 and 2015/16.
The current event has not yet reached the winter peak values of those historic El Niños. However, the speed of the 2026 transition is exceptional, and a very strong event is now the leading scenario.
The most accurate wording today: El Niño 2026/27 is rapidly intensifying and is likely to become very strong; a super or record-strength peak remains a credible high-end scenario.
The Atmosphere Is Responding: MEI Has Also Jumped
The Multivariate ENSO Index (MEI) combines several oceanic and atmospheric variables. In the cited June–July 2026 analysis, MEI reached +2.4.
This matters because MEI does not look at ocean temperature alone. It measures how much the combined “ocean + atmosphere” system already resembles a mature El Niño.
Simple analogy: sea temperature is one symptom. MEI is more like a full medical checkup — temperature, blood pressure, pulse and breathing together. When all the indicators shift in the same direction, the diagnosis becomes more convincing.
An Active Pacific Does Not Mean Every Typhoon Is Caused by El Niño
NASA’s natural-event monitoring system has recently tracked several active or recently active tropical systems in the Pacific, including Super Typhoon Dolphin, Tropical Cyclone Chan-Hom, Tropical Storm Peilou and Tropical Storm 15W.
According to NASA and the Joint Typhoon Warning Center, Dolphin reached around 145 knots, or about 167 mph / 269 km/h, while Chan-Hom strengthened to roughly 50 knots, or about 58 mph / 93 km/h.
What is a knot? It is a speed unit used in marine and aviation weather. One knot equals about 1.15 mph or 1.85 km/h.
But this distinction matters: one typhoon does not prove El Niño. Tropical cyclones depend on local ocean heat, moisture, wind shear and many other factors. They can illustrate an active Pacific, but the best evidence for El Niño comes from ocean temperature indices, subsurface heat, wind changes and the atmospheric response.
El Niño Winter 2026–2027: What It Could Mean for the United States
Current ECMWF seasonal guidance already shows a circulation pattern more typical of a mature El Niño: lower pressure over the North Pacific, higher pressure over Canada and a more active storm corridor across the southern United States.
For the U.S., that increases the likelihood of a stronger subtropical jet stream.
What is the jet stream? It is a fast-moving “river of air” roughly 6–8 miles above the ground. It helps steer storms and fronts. When its path shifts, the main corridors for rain, snow and storms can shift too.
In late autumn and winter, this pattern can favor wetter conditions from the Southwest and Gulf Coast toward the Southeast and East.
At the same time, the Pacific Northwest and parts of southern Canada may lean drier in the seasonal signal.
El Niño Winter Forecast for Canada
If a very strong El Niño persists into winter, the classic large-scale pattern favors a deeper low-pressure zone near the Aleutian Islands, a stronger Pacific jet and more storm activity across the southern U.S.
What is a low-pressure system? It is an area where air converges and rises. Rising air helps clouds and precipitation form. In simple terms, lower pressure is often associated with more active and changeable weather.
Large parts of Canada and the northern tier of the United States tend to spend more time on the milder side of the winter circulation in this type of setup.
Snow is more complicated. Seasonal models can indicate where snow potential is above or below normal, but they cannot tell us months in advance where a specific snowstorm will hit. El Niño is much better at forecasting the general circulation pattern than an individual winter storm.
El Niño Effects in Europe: Real, but Less Direct
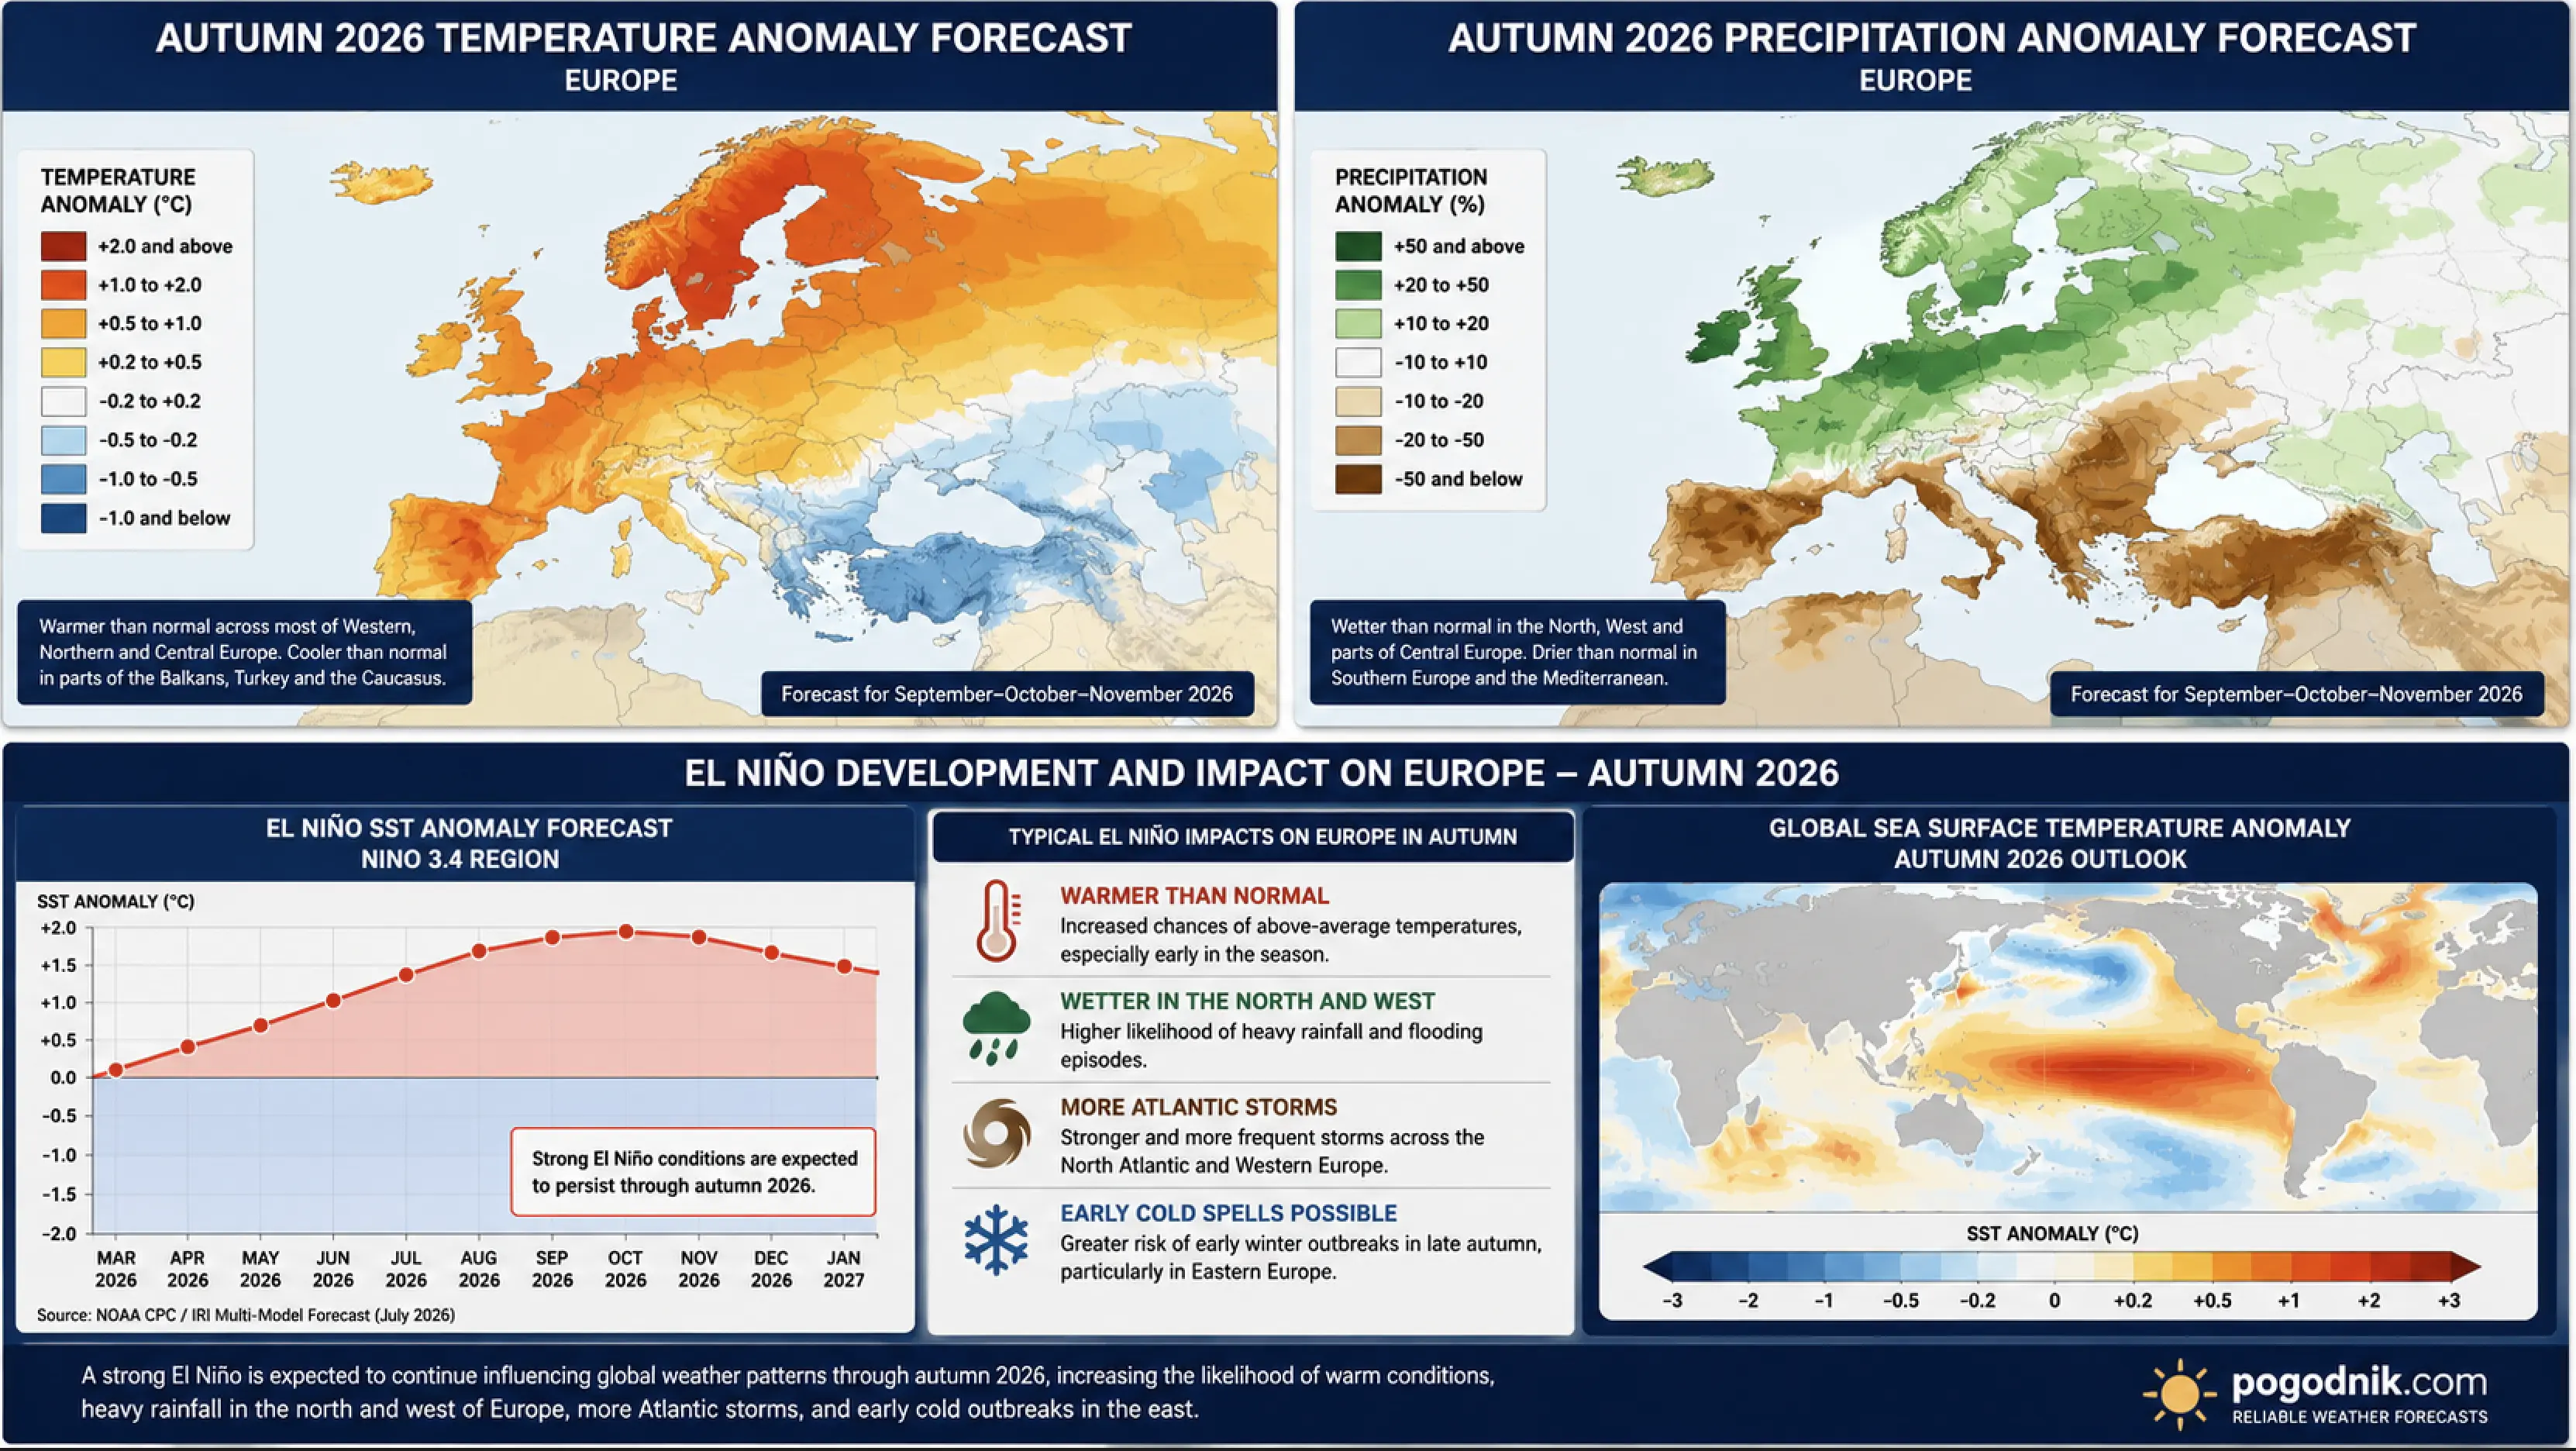
For Europe, the connection between El Niño and winter weather is weaker and less direct than it is for North America. The tropical Pacific first changes global atmospheric wave patterns. Those changes can then influence the North Atlantic, which in turn affects Europe.
Simple analogy: throw a stone into a pond. The wave is strongest close to where the stone lands and weaker farther away, where it mixes with other waves. El Niño affects the United States more directly; Europe is farther down the chain of atmospheric influences.
Current ECMWF seasonal guidance points toward lower-than-normal pressure over the North Atlantic and stronger west-to-southwest airflow into Europe.
What is westerly flow? It means air and storm systems more often move into Europe from the Atlantic, from west to east. This setup usually favors milder, wetter and windier weather in western and northern Europe.
Under this pattern, much of Europe has a higher probability of warmer-than-normal seasonal temperatures, while moist Atlantic air may bring more frequent precipitation to western and northern areas.
For December through February, the current seasonal signal also leans toward positive temperature anomalies and stronger Atlantic influence across much of Europe.
But a mild winter average does not mean there will be no frost or snow. Short but sharp outbreaks of Arctic air can still occur even during an overall warmer season.
What is an Arctic outbreak? It is a fast push of very cold air from the far north into lower latitudes. That is why a winter that is mild on average can still produce several days of hard freezes and snow.
Why Model Agreement Matters More Than One Dramatic Forecast Map
Forecast system
Main signal
NOAA CPC
El Niño Advisory, rapid strengthening and an 81% probability of a very strong event in October–December
NOAA RONI
A rapid observed shift from −0.9°C in winter to +1.0°C by May–July
NMME
Further strengthening toward the end of 2026
IRI
Near-total confidence that El Niño persists into early 2027
ECMWF
A very warm tropical Pacific and continued atmospheric response
MEI
A strong, synchronized ocean-atmosphere shift
The Biggest Uncertainty Is Not El Niño — It Is How Strong the Peak Becomes
The probability that El Niño persists into winter is now very high. The probability that it becomes strong or very strong is also high.
The unresolved question is whether the 2026/27 event becomes record-strength. NOAA’s 81% probability refers to the “very strong” category, not a guaranteed peak of +2.4, +2.7 or +3.0°C.
Simple analogy: we are increasingly confident the train will reach the station called “very strong El Niño.” What we do not know yet is whether it continues to the next station — “record-breaking.”
What Happens Next in the El Niño 2026 Forecast?
The most likely scenario is continued strengthening through autumn, a peak in late autumn or early winter 2026/27, and then gradual weakening during early 2027.
For North America, that raises the odds of a more active southern storm corridor, wetter conditions across parts of the southern and eastern United States, and milder conditions across much of Canada.
For Europe, current seasonal models lean toward a milder, more Atlantic-driven winter circulation overall, although individual cold waves and snow events remain possible.
The next 6–10 weeks should provide the clearest answer to the central question behind the 2026 Super El Niño forecast: will this become simply a very strong El Niño, or will it enter the small group of the most powerful modern events?
Track Long-Range Weather with Weather Forecaster
Weather Forecaster provides hourly and long-range forecasts, temperature, precipitation, wind and severe-weather information for locations across the United States, Europe and worldwide.
Yes. NOAA has an El Niño Advisory in effect, and both oceanic and atmospheric indicators show an established event that is rapidly strengthening.
How strong could El Niño 2026/27 become?
NOAA gives an 81% probability of a very strong El Niño during October–December 2026. A record or “super” peak is possible, but not guaranteed.
What does NOAA’s 81% probability mean?
It is the probability that the event reaches NOAA’s very strong category during October–December. In simple terms, the official outlook strongly favors a powerful event, but does not guarantee an exact peak value.
When will El Niño peak?
The most likely peak is in late autumn or early winter 2026/27.
What could El Niño mean for the U.S. winter?
It increases the odds of a stronger southern storm track and wetter conditions across parts of the southern and eastern United States, while the northern tier may lean milder.
What could El Niño mean for Canada?
A strong El Niño generally raises the probability of a milder winter circulation across large parts of Canada, although regional exceptions remain possible.
What could El Niño mean for Europe?
The connection is less direct, but current seasonal guidance favors a milder and more Atlantic-driven circulation on average. Short cold spells and snow events can still occur.
Does an active typhoon season prove El Niño?
No. Individual tropical cyclones cannot be directly attributed to El Niño. The strongest evidence comes from Pacific temperature anomalies, subsurface heat, wind changes and the coupled atmospheric response.
Updated August 13, 2026. Seasonal forecasts describe probabilities and large-scale patterns; they do not guarantee the weather in a specific city or predict an individual storm months in advance.
The Founder and Chief Meteorologist at Pogodnik.com. With over 15 years of operational experience in synoptic analysis and climate forecasting, he specializes in storm tracking, magnetic storms, and atmospheric dynamics. A recognized expert in Ukraine’s meteorological sector, he maintains strategic collaborations with global agencies, including NOAA and ECMWF, to ensure high-precision data integration. His analytical reviews and scientific contributions are regularly featured in leading media outlets dedicated to weather science and environmental trends.