Super El Niño 2026–2027 Is Accelerating: What NOAA’s Forecast Means for the U.S. and Europe
The tropical Pacific Ocean is warming at an extraordinary pace. Satellite maps show a broad and nearly continuous ribbon of unusually warm water stretching from the coast of South America deep into the central Pacific, while daily sea-surface temperatures in the Niño 3.4 region have climbed to levels normally associated with a much later stage of El Niño development. The event is already reshaping global weather risks, but the observations, official forecasts and most extreme model scenarios must be kept separate.
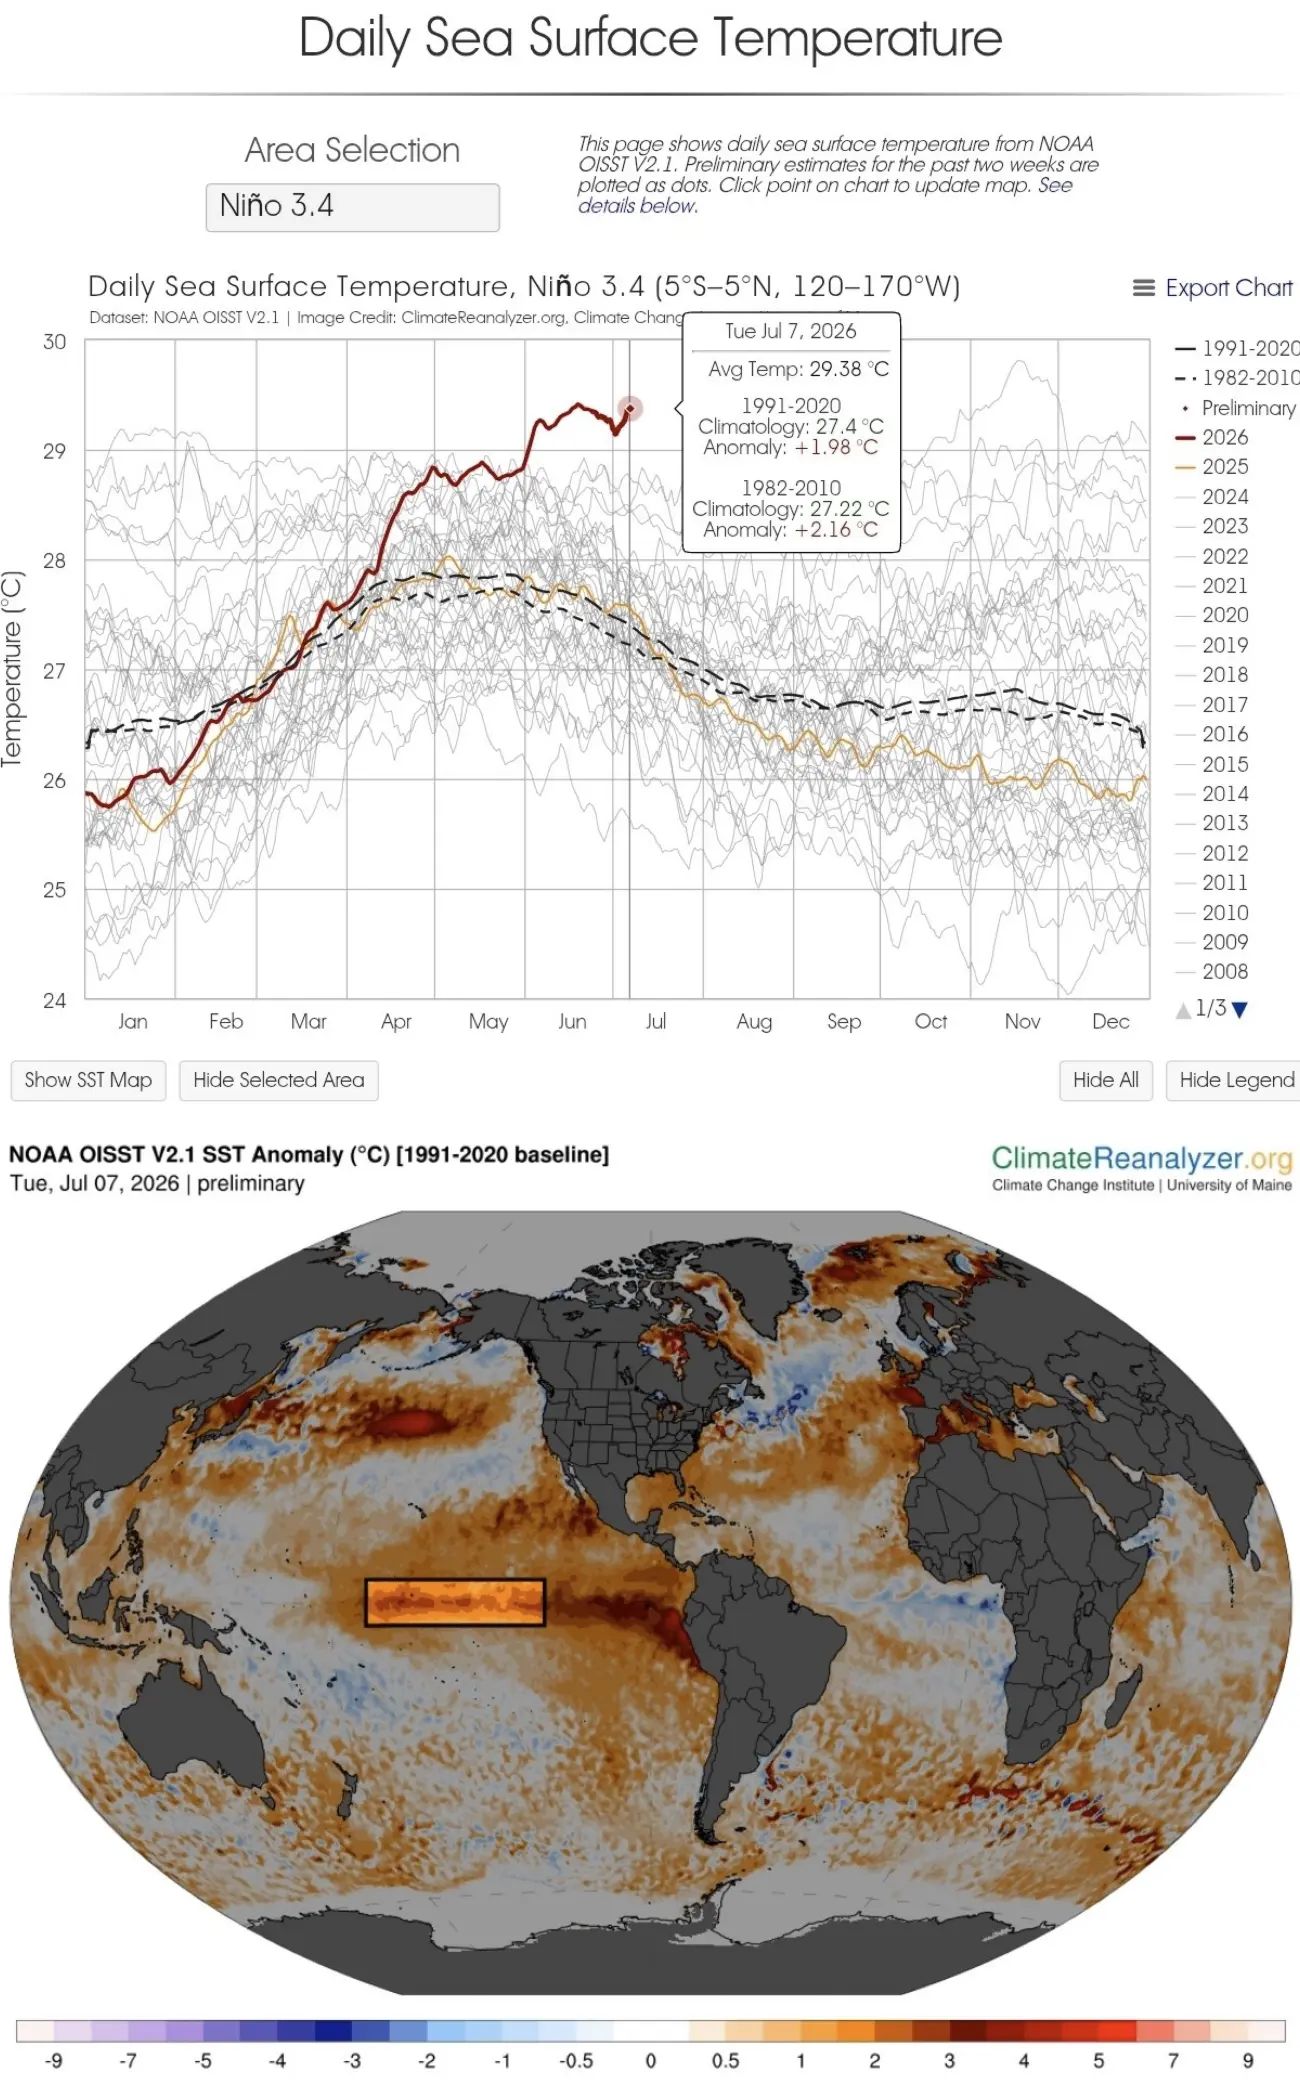
What is confirmed: the supplied NOAA OISST-based chart shows a Niño 3.4 daily sea-surface temperature of 29.38°C, or 84.9°F, on July 7 — 1.98°C above the 1991–2020 average.
Official NOAA forecast: El Niño has a 97% chance of persisting into early spring 2027 and an 81% chance of reaching the very strong category during October–December 2026.
United States: El Niño is already tilting the 2026 hurricane outlook toward a quieter Atlantic but a more active eastern and central Pacific. Winter risks may shift toward a wetter southern storm track.
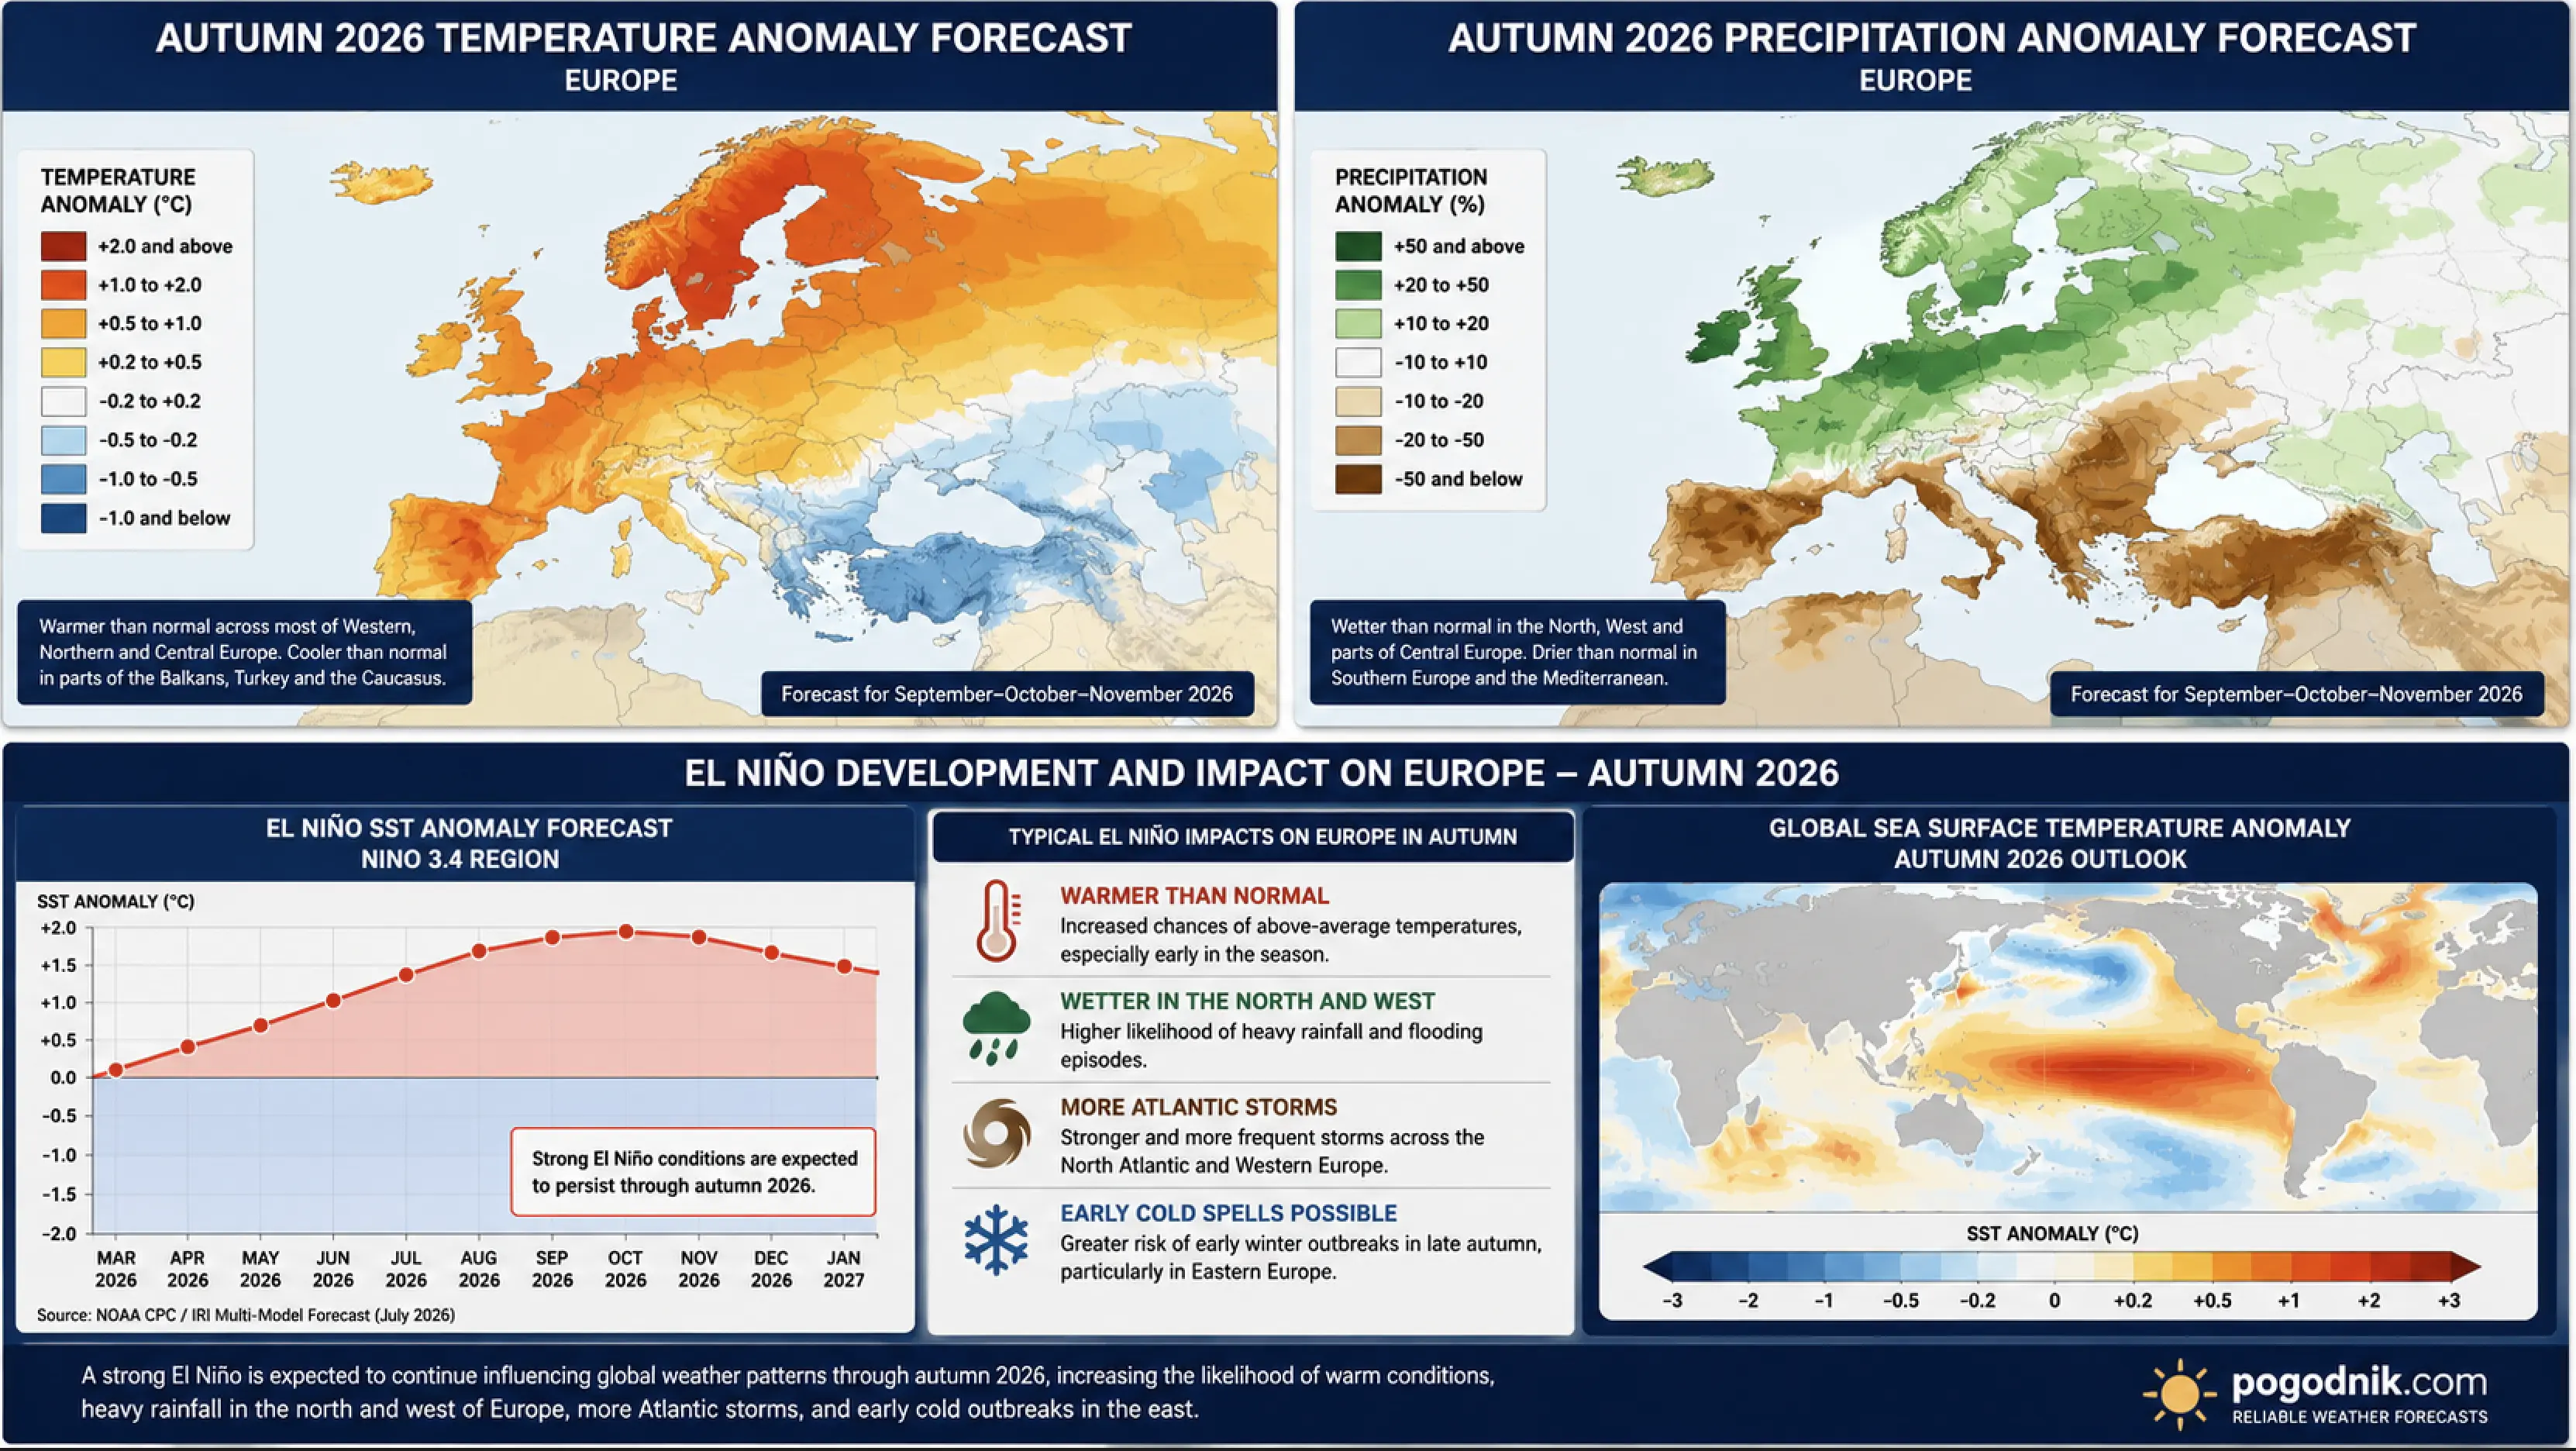
Europe: the influence is less direct and less predictable, but a strong event may affect the North Atlantic circulation, winter storm tracks and the risk of Polar Vortex disruption later in winter.
What is not confirmed: an official RONI peak of +3.6°C, a 94% Super El Niño probability or an almost certain annual global temperature increase above 2°C.
El Niño 2026 in four numbers
29.38°C Daily Niño 3.4 sea-surface temperature on July 7, equal to about 84.9°F
+1.98°C Daily Niño 3.4 anomaly relative to the 1991–2020 climatology
81% NOAA probability of a very strong El Niño during October–December
97% Probability that El Niño persists into early spring 2027
Fact-checking the biggest Super El Niño claims
Claim
What the official evidence shows
Assessment
El Niño is exactly seven weeks ahead of every previous event
The temperature chart does show unusually early and intense warming. However, NOAA and the WMO have not issued an official seven-week comparison with every historical event.
Not established
RONI will definitely peak at +3.6°C
NOAA’s official outlook is probabilistic. Individual model members may generate extreme peaks, but NOAA has not adopted +3.6°C as its official forecast.
Not confirmed
There is a 94% probability of Super El Niño
NOAA gives an 81% chance of a very strong event during October–December, 75% during November–January and 54% during December–February.
Higher than NOAA
2027 will almost certainly exceed 2°C above pre-industrial levels
The WMO says 2027 could become the warmest year on record, but the probability that any single year during 2026–2030 exceeds 2°C is below 1%.
Contradicts WMO
The event could rank among the strongest since 1950
NOAA explicitly states that a very strong event would rank among the largest El Niño events in the historical record beginning in 1950.
Confirmed
What the ocean charts show
Global SST anomaly pattern
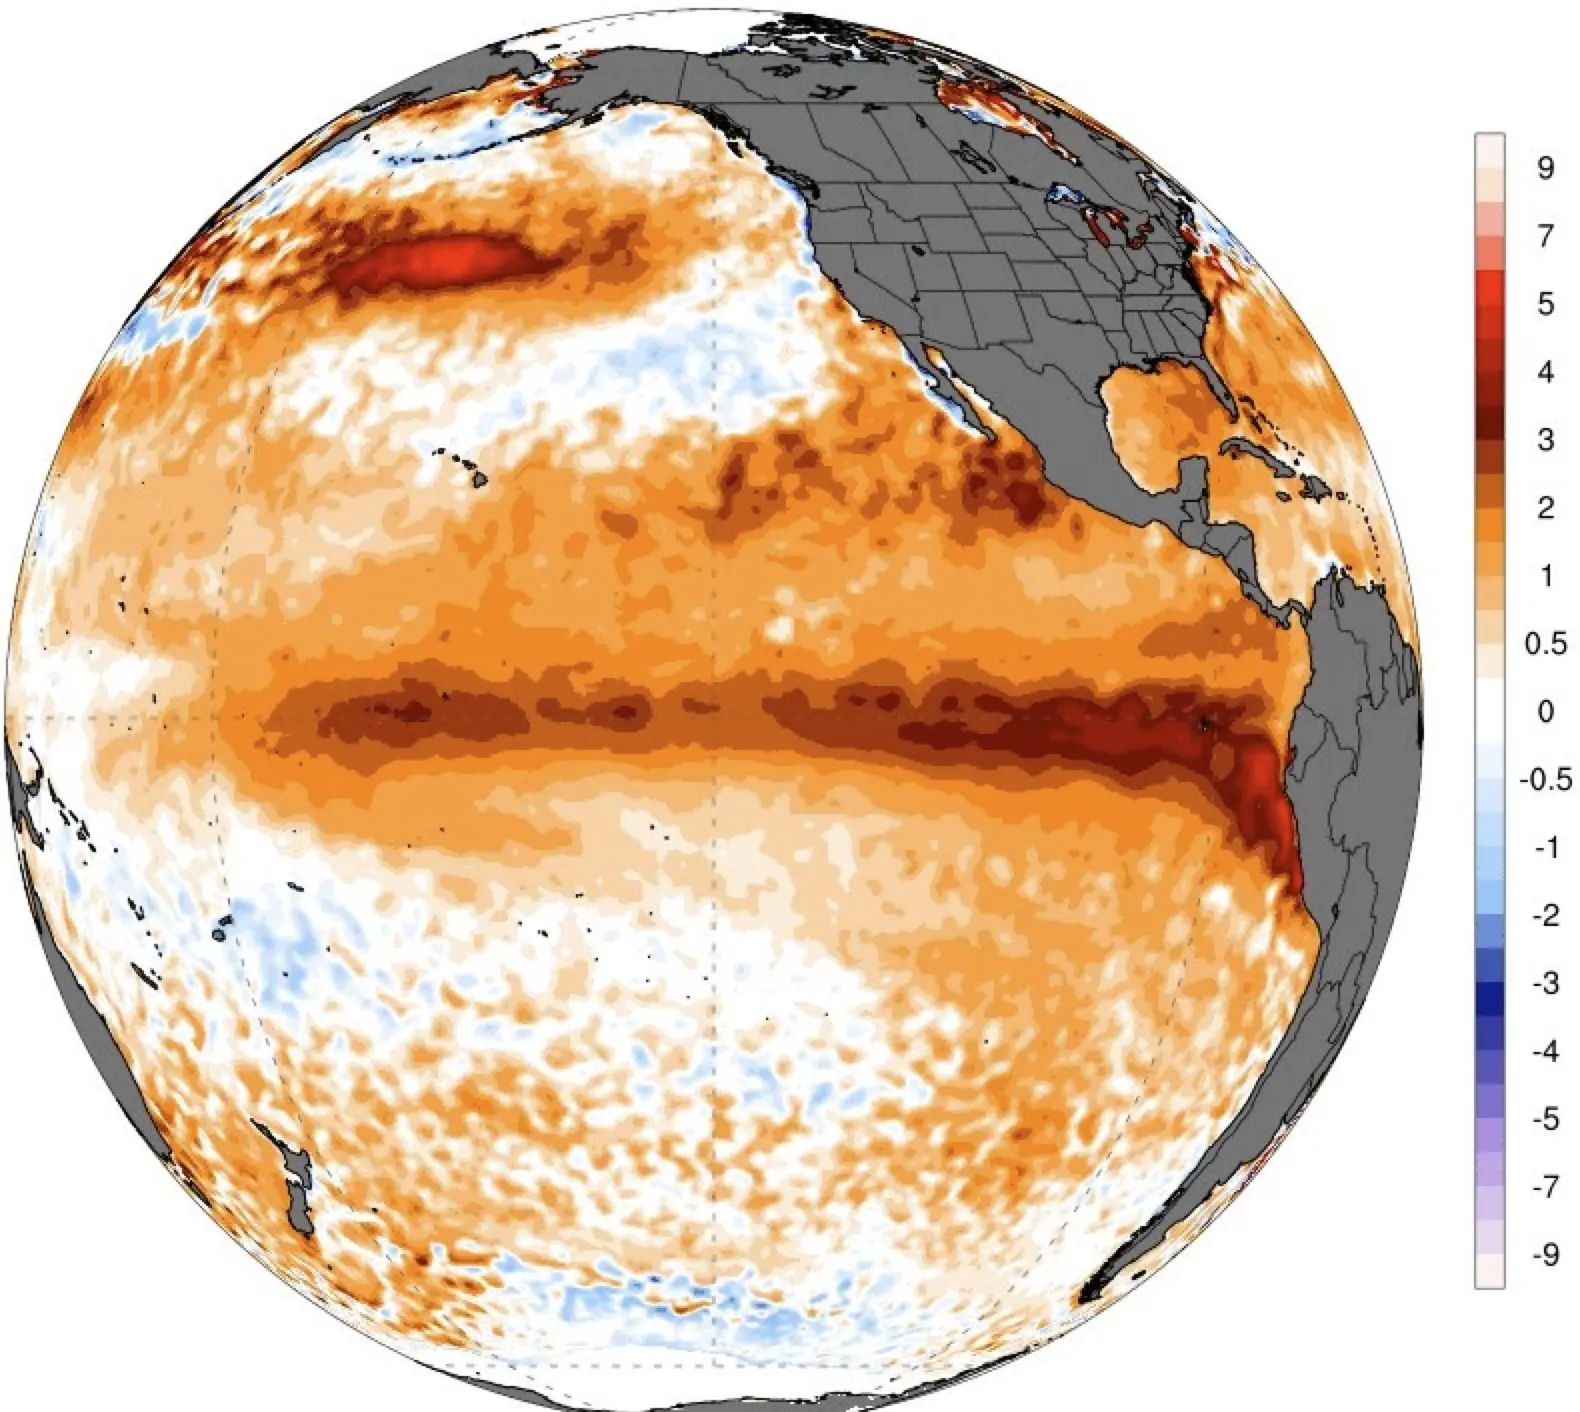
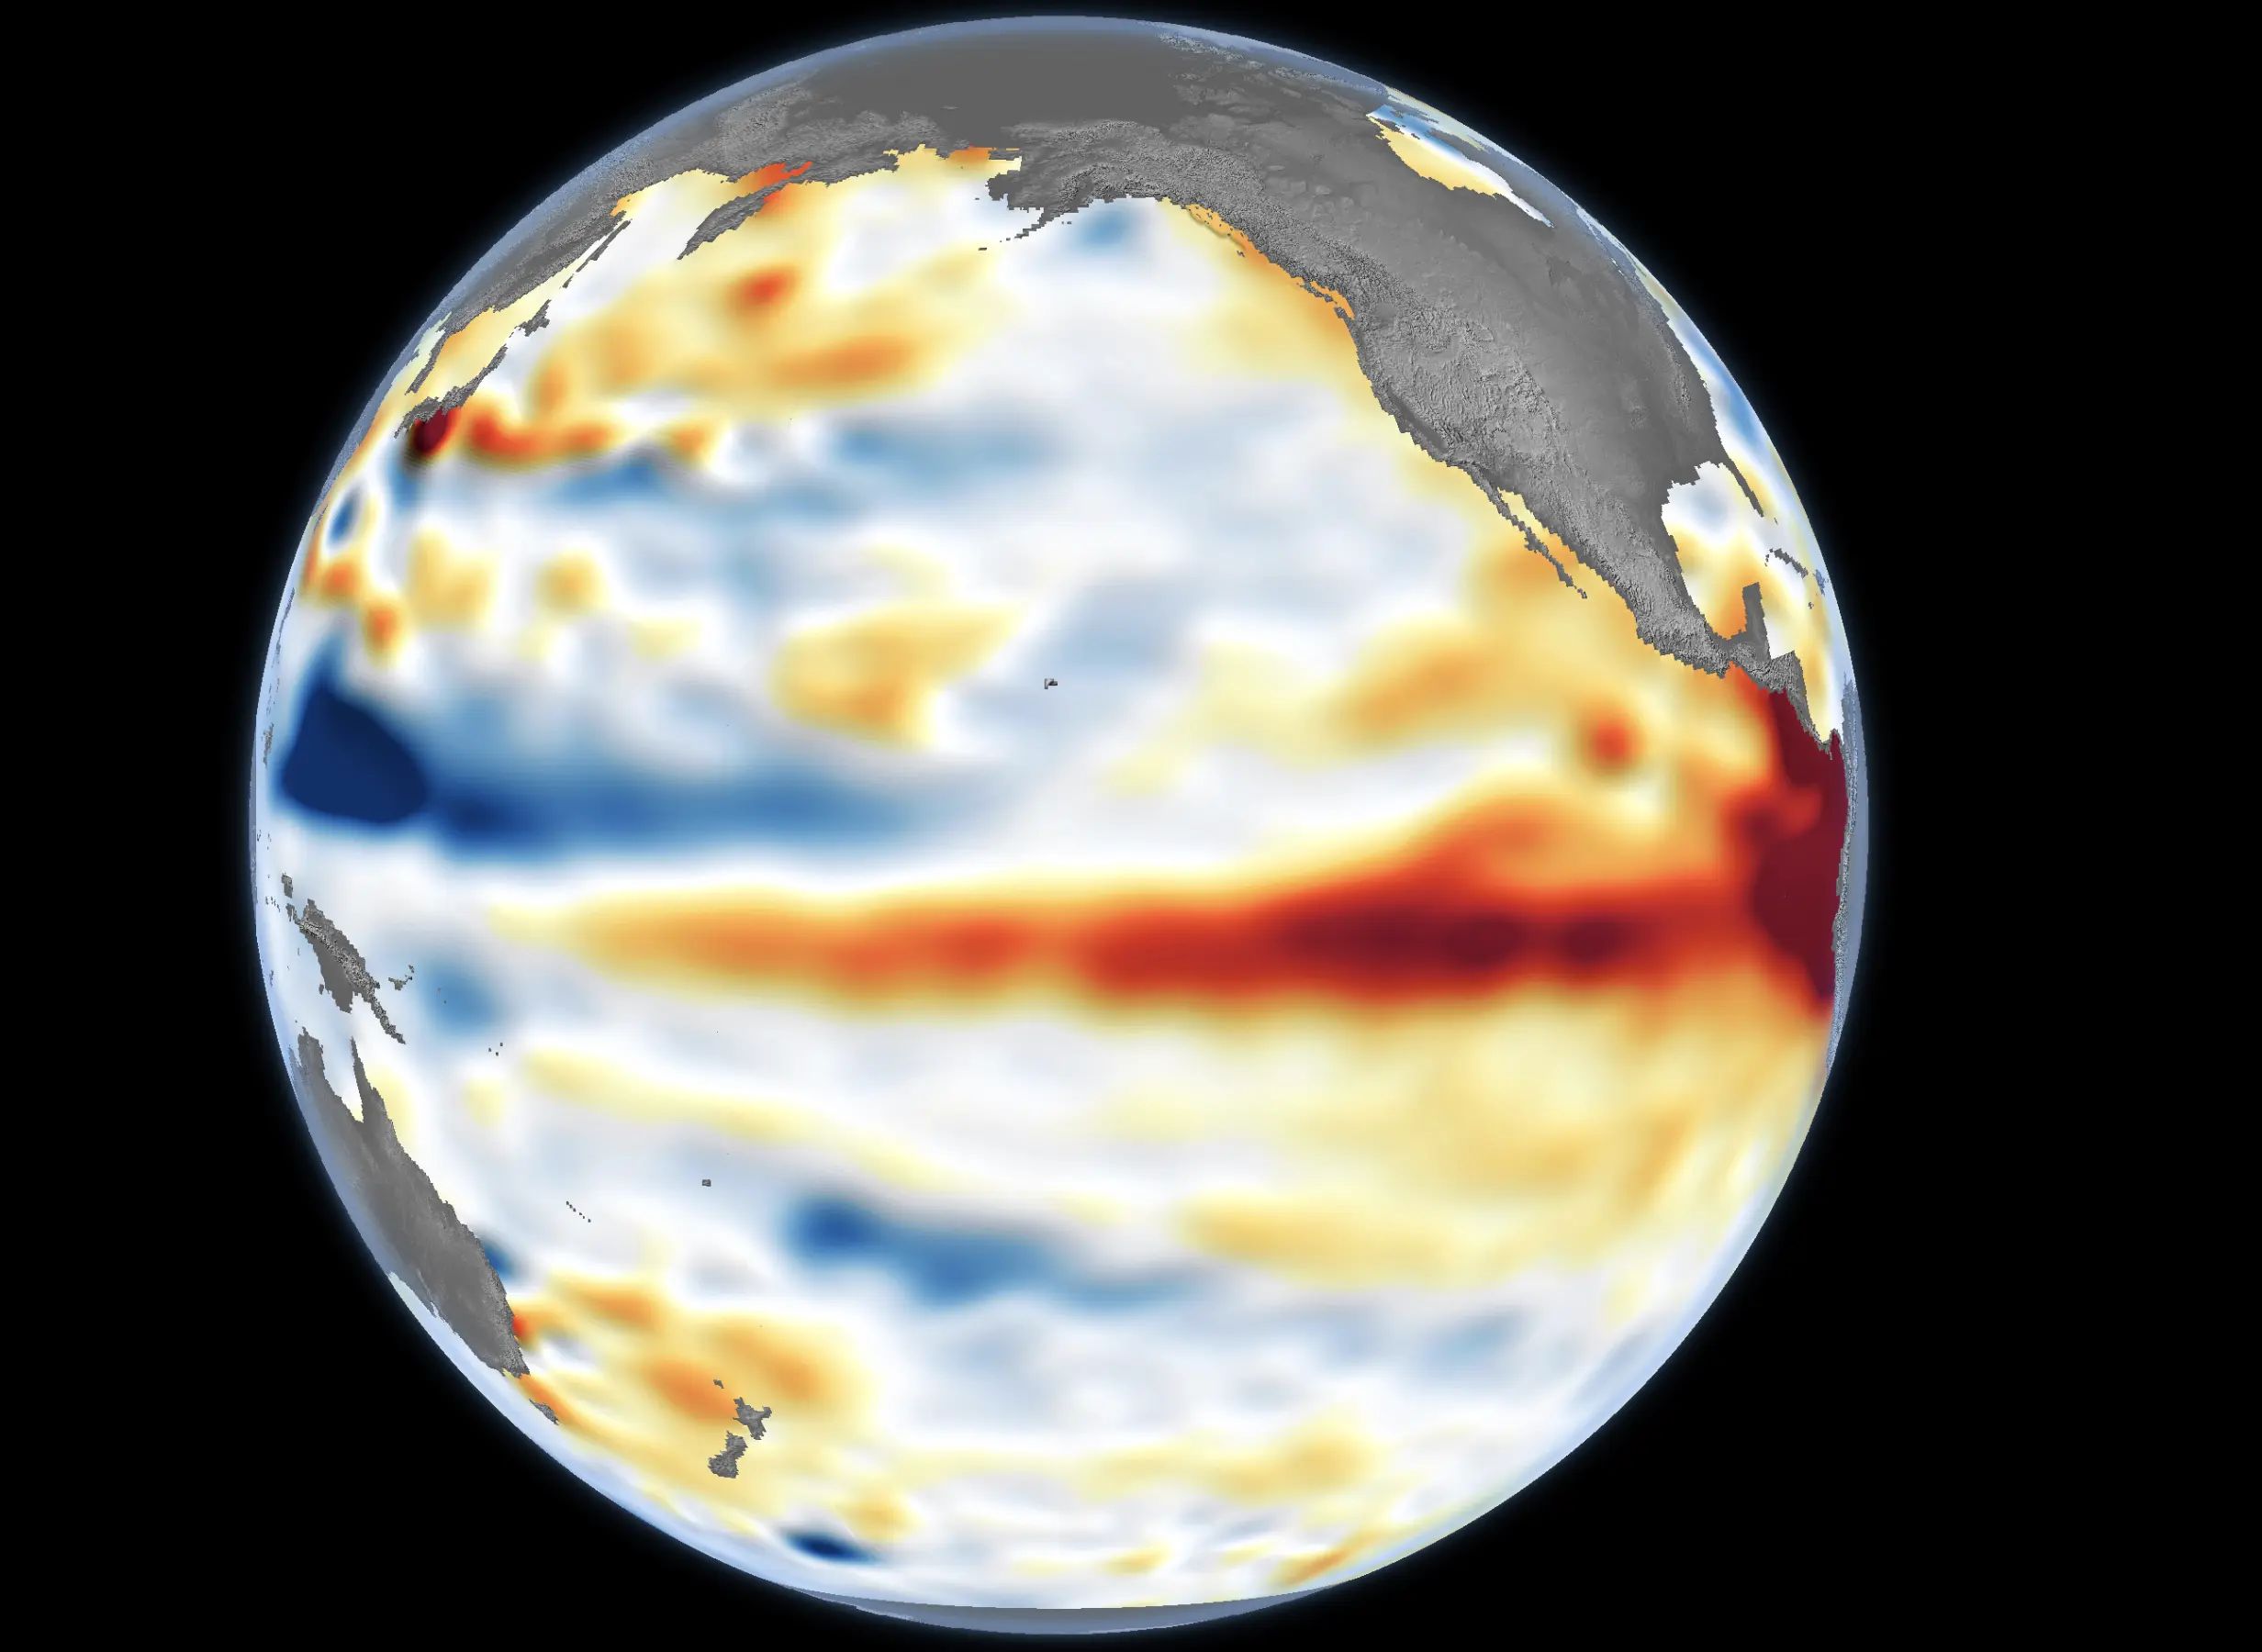
The global map shows a powerful warm anomaly extending westward along the equator from Peru and Ecuador into the central Pacific. This elongated structure is the classic oceanic footprint of a developing El Niño.
Some areas near South America appear several degrees warmer than average. The map uses a 1971–2000 baseline, however, so its color scale should not be compared directly with maps using the newer 1991–2020 reference period.
The Niño 3.4 daily curve
On July 7, the average temperature in the Niño 3.4 monitoring region reached 29.38°C, or 84.9°F. That was 1.98°C above the 1991–2020 average and 2.16°C above the older 1982–2010 climatology shown on the chart.
The 2026 red line stands clearly above most previous years for early July, confirming both the strength and unusually early timing of the warming.
Central versus eastern Pacific
The outlined Niño 3.4 region contains widespread anomalies of roughly +1°C to +3°C, while the easternmost Pacific near South America is considerably warmer.
This suggests a strong eastern-Pacific component in July. The final spatial character of the event will become clearer as it approaches its expected autumn and winter peak.
Why a daily +1.98°C anomaly is not the same as RONI +1.98°C
The Climate Reanalyzer chart uses daily NOAA OISST sea-surface temperature data. This is a high-frequency observational indicator that can change quickly because of winds, cloud cover, ocean mixing and the passage of Kelvin waves.
NOAA’s official Relative Oceanic Niño Index, or RONI, is calculated differently. It uses a three-month average in the Niño 3.4 region and adjusts the anomaly for the warming background of the tropical oceans.
A daily anomaly, a monthly anomaly and a three-month RONI value are therefore not interchangeable. The daily chart can show an extremely strong short-term signal without proving that the official seasonal index has already reached the same level.
NOAA adopted RONI for operational ENSO classification in 2026 because the older Oceanic Niño Index could increasingly mix the El Niño signal with the broader warming of the tropical oceans.
Why the Pacific is warming so quickly
The development is not limited to the surface. A large reservoir of abnormally warm water has accumulated below the equatorial Pacific and is spreading eastward.
Westerly wind bursts during early 2026 helped launch downwelling equatorial Kelvin waves. These waves deepen the thermocline in the eastern Pacific, reduce the normal upwelling of cold subsurface water and allow the surface to warm rapidly near South America.
NOAA’s July ocean-monitoring analysis shows that warming strengthened across the central and eastern equatorial Pacific during June. It also identified a strong coastal Niño near South America and persistent marine heatwave conditions in parts of the tropical Pacific.
Weaker trade winds allow warm western-Pacific water to move east.
Kelvin waves carry subsurface heat toward South America.
A deeper thermocline suppresses the normal supply of cold water from below.
Enhanced tropical convection shows that the atmosphere is responding to the warm ocean.
Negative Southern Oscillation indices confirm stronger ocean-atmosphere coupling.
How strong could El Niño become during winter 2026–2027?
NOAA places El Niño in the very strong category when the three-month RONI reaches at least +2.0°C. The phrase “Super El Niño” is commonly used for events of this scale, but it is not a separate official warning category.
Three-month season
Moderate +1.0 to +1.4°C
Strong +1.5 to +1.9°C
Very strong +2.0°C or higher
July–September 2026
26%
57%
16%
August–October 2026
10%
42%
48%
September–November 2026
4%
25%
71%
October–December 2026
3%
16%
81%
November 2026–January 2027
5%
20%
75%
December 2026–February 2027
12%
32%
54%
The highest probability of an extreme peak is concentrated in autumn and early winter. The very-strong probability then declines as the event moves beyond its most likely seasonal maximum.
Could El Niño 2026–2027 become the strongest on record?
It is too early to declare a new absolute record. NOAA’s operational RONI record begins in 1950, and the most powerful events in that dataset include 1982–1983, 1997–1998 and 2015–2016.
El Niño event
Approximate historical RONI peak
Context
1982–1983
About +2.5°C
One of the highest values in NOAA’s RONI record since 1950.
1997–1998
About +2.4°C
A globally disruptive event associated with floods, drought and major ecosystem impacts.
2015–2016
About +2.4°C
Coincided with record-high global temperatures.
2026–2027
Peak has not occurred
NOAA says it could rank among the largest events in the post-1950 record.
The 1877–1878 El Niño is widely considered one of the strongest events in historical reconstructions, but it cannot be compared directly with modern RONI values to the nearest tenth of a degree. Nineteenth-century observations did not include satellites, global buoy networks or modern ocean reanalysis.
Global impacts expected through summer and autumn 2026
The WMO expects El Niño to strengthen rapidly during July–September, with the multi-model seasonal Niño 3.4 anomaly exceeding 2°C in key monitoring regions.
Region
Most likely broad signal
Potential risks
Central and eastern tropical Pacific
Warmer ocean and enhanced rainfall
Heavy rain, coastal flooding, marine ecosystem stress and fisheries disruption
Australia
Higher probability of rainfall deficits
Drought, heat, wildfire danger and agricultural stress
India and South Asia
Risk of weaker or disrupted monsoon rainfall in some areas
Water shortages, agricultural losses and heat stress
Central America and Caribbean
Greater risk of below-normal rainfall
Drought, water stress and crop losses
Southwestern United States
Higher winter and cool-season precipitation potential
Heavy rain, flash floods, debris flows and mountain snow
Europe
Indirect and lower-confidence circulation changes
Shifts in Atlantic storms, rainfall patterns and winter temperature contrasts
What Super El Niño could mean for the United States
El Niño has one of its clearest extratropical influences over North America. During many strong events, the subtropical jet stream becomes more active across the southern United States, increasing the supply of Pacific moisture from California and the Southwest toward Texas, the Gulf Coast and the Southeast.
That does not mean every strong El Niño produces identical weather. The Pacific Decadal Oscillation, Arctic Oscillation, Madden–Julian Oscillation, Polar Vortex and individual storm tracks can all strengthen or disrupt the classic pattern.
U.S. region
Possible El Niño tendency
Main risks to monitor
California and Southwest
Greater potential for an active Pacific storm track during the cool season
Atmospheric rivers, flooding, debris flows and heavy mountain snow
Texas and Southern Plains
Wetter and stormier periods become more likely
Flooding, severe thunderstorms, cold rain and occasional ice during Arctic intrusions
Gulf Coast and Southeast
More frequent southern-jet storm systems
Heavy rain, flooding, severe storms and coastal impacts
Ohio and Tennessee valleys
Potential battleground between southern moisture and northern cold air
Rain-to-snow transitions, freezing rain and winter storms
Northeast
Snowfall depends heavily on whether cold air is available when coastal storms develop
Nor’easters, heavy wet snow, rain, ice and coastal flooding
Northern Plains and Upper Midwest
Milder seasonal background is possible, but Arctic outbreaks remain possible
Rapid temperature swings, blizzards and dangerous wind chills
Pacific Northwest
Can lean milder or drier during classic strong El Niño winters
Reduced mountain snow in some areas, although individual storms can still be intense
El Niño is already reshaping the 2026 hurricane outlook
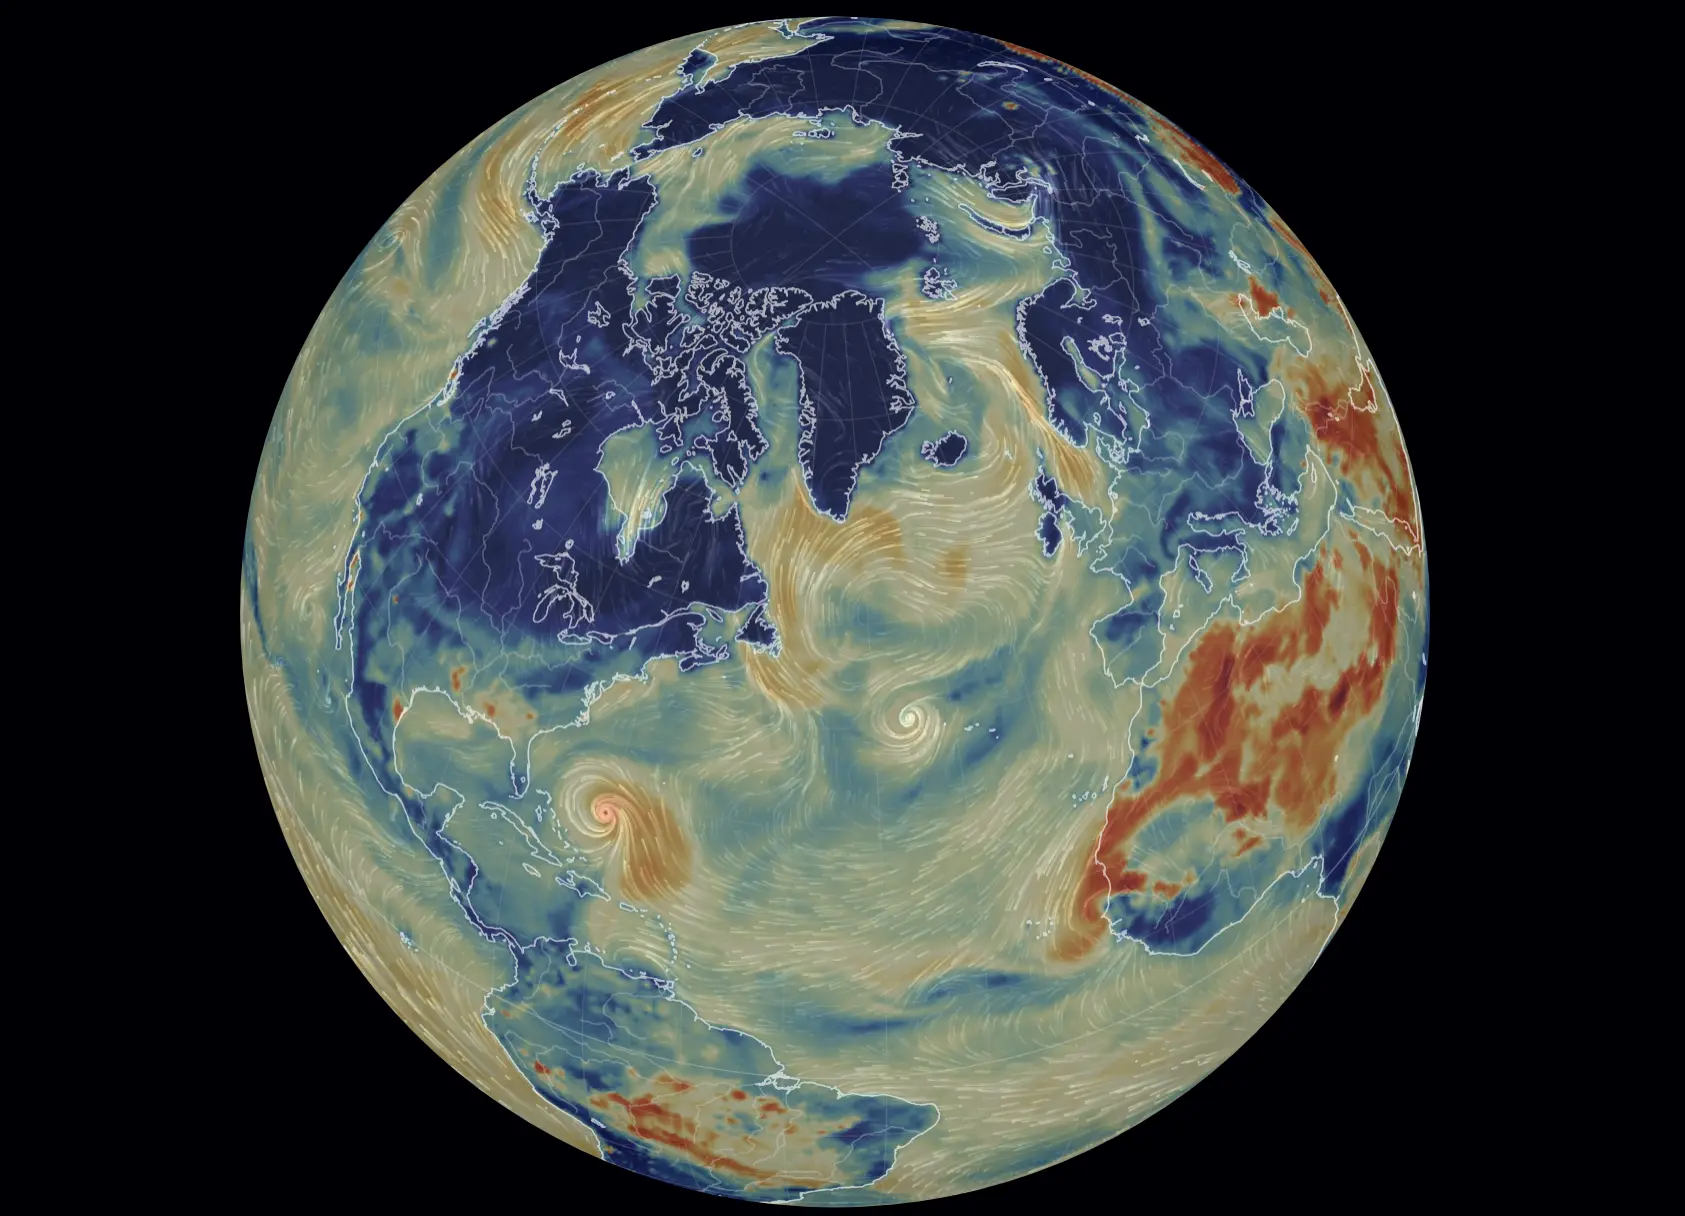
El Niño usually increases upper-level wind shear over the tropical Atlantic. Stronger shear disrupts the vertical structure of developing tropical cyclones and can reduce the overall number of Atlantic hurricanes.
NOAA gives the 2026 Atlantic hurricane season a 55% probability of below-normal activity, compared with a 35% probability of a near-normal season and a 10% probability of an above-normal season.
NOAA forecasts 8–14 named storms, including 3–6 hurricanes and 1–3 major hurricanes. A less active basin does not mean a low landfall risk: one storm striking a populated coastline can still define the season.
The eastern Pacific has the opposite signal. NOAA gives that basin a 70% probability of above-normal activity, with 15–22 named storms, 9–14 hurricanes and 5–9 major hurricanes.
The central Pacific is also expected to be more active than normal, increasing the need for Hawaii and Pacific shipping routes to monitor tropical development closely.
What Super El Niño could mean for Europe
El Niño’s influence on Europe is weaker, less direct and more variable than its influence on North America. The signal must travel through the tropical Pacific, planetary-wave patterns, the North Pacific, North America, the North Atlantic and sometimes the stratosphere.
A very strong event can alter the odds of certain European patterns, but it cannot determine the exact winter outcome by itself. The North Atlantic Oscillation, Arctic Oscillation, QBO, Arctic sea ice and Polar Vortex will remain essential.
An active Atlantic pattern may favor mild, wet and windy periods
Brief snow or ice remains possible if high-latitude blocking interrupts the westerly flow
France and Benelux
More Atlantic storm systems and frequent rain are possible
Flooding, windstorms and rapid freeze-thaw transitions during cold interruptions
Germany and Central Europe
Potentially milder seasonal background, especially in western areas
Eastern cold intrusions can still produce snow, ice and sharp temperature drops
Alps
Active storms can produce substantial high-elevation snow
Lower valleys may alternate between snow, rain and thaw conditions
Scandinavia and Baltic region
Large swings between Atlantic warmth and Arctic cold remain possible
Blizzards, freezing rain and severe cold during blocking episodes
Italy and Mediterranean Europe
A displaced Atlantic or Mediterranean storm track may raise heavy-rain risk
Flooding, coastal storms, mountain snow and landslides
Eastern Europe
Highly sensitive to Polar Vortex behavior and Scandinavian blocking
Thaws can alternate with snow, freezing rain and short but severe cold waves
Could El Niño weaken the Polar Vortex?
Strong El Niño events can enhance large planetary waves that travel upward from the troposphere into the stratosphere. Under the right pressure pattern, that wave energy can weaken, stretch or displace the Polar Vortex.
A weaker Polar Vortex does not automatically make the entire United States or Europe cold. Instead, it increases the chance that Arctic air can escape into one or more mid-latitude regions.
The timing is also important. Early winter may remain relatively mild or stormy, while a major stratospheric disruption in January or February could produce a rapid change several weeks later.
This is why a strong El Niño winter can still contain major snowstorms or Arctic outbreaks even when the seasonal temperature average finishes above normal.
Could 2027 become the first calendar year to reach 2°C?
A powerful El Niño increases the probability of a new global temperature record because the tropical Pacific releases additional heat into the atmosphere.
The WMO says the expected late-2026 El Niño raises the chance that 2027 becomes the next record-warm year. However, the official outlook does not support claims that a 2°C calendar-year anomaly is nearly inevitable.
Annual global temperatures during 2026–2030 are forecast to range between approximately 1.3°C and 1.9°C above the 1850–1900 average. The probability that at least one year temporarily exceeds 1.5°C is 91%.
The probability that any individual year exceeds 2°C remains below 1%. A temporary annual exceedance would also not mean that the Paris Agreement threshold had been permanently crossed, because that threshold refers to long-term warming averaged over decades.
Track local weather impacts in Weather Forecaster
El Niño shapes the global climate background, but dangerous weather occurs locally. Weather Forecaster provides hourly temperature, rainfall, thunderstorms, wind, air quality, wildfire maps and geomagnetic activity for your location.
Check the forecast before travel, outdoor work, winter storms, heatwaves or rapid temperature changes.
Weekly Niño 3.4: shows short-term acceleration or weakening of central-Pacific warming.
Three-month RONI: NOAA’s official index for classifying the event’s seasonal strength.
Niño 1+2: measures coastal warming near Peru and Ecuador.
Trade winds: continued weakening would support additional eastward movement of warm water.
Kelvin waves: new subsurface pulses could strengthen the autumn peak.
Southern Oscillation Index: shows how strongly the tropical atmosphere has coupled with the ocean.
Pacific Decadal Oscillation: can modify how El Niño affects western North America.
North Atlantic Oscillation: will be critical for European storm tracks and winter temperatures.
QBO and Polar Vortex: important for the risk of mid-winter Arctic outbreaks across the U.S. and Europe.
Arctic sea ice: may influence high-latitude blocking and the stability of the polar circulation.
Main forecast conclusion
El Niño 2026–2027 is developing unusually quickly and already displays one of the strongest early-July signals of the modern satellite era. The daily Niño 3.4 temperature is nearly 2°C above the modern average, warming is even stronger in the eastern Pacific, and the ocean and atmosphere are now operating as a coupled El Niño system.
The probability of a very strong event is genuinely high. But the official July figure is 81% for October–December, not 94%. NOAA has not confirmed a guaranteed RONI peak of +3.6°C, and comparisons with 1877 to the nearest tenth of a degree are not scientifically robust.
The most important story is not one model number. It is the growing range of possible consequences: disrupted rainfall, drought and flood risk, a quieter Atlantic hurricane season, a more active eastern Pacific season, a wetter southern U.S. winter pattern and greater uncertainty in European winter circulation.
FAQ
Has El Niño 2026 officially begun?
Yes. NOAA issued an El Niño Advisory in June 2026 and confirmed on July 9 that the event was strengthening.
How warm is the Niño 3.4 region?
The supplied NOAA OISST-based daily chart shows an average temperature of 29.38°C, or 84.9°F, on July 7. That was 1.98°C above the 1991–2020 average.
Will this become a Super El Niño?
The probability is high. NOAA gives an 81% chance of a very strong event during October–December 2026, but the final strength will only be known near the seasonal peak.
Does NOAA forecast RONI at +3.6°C?
No. NOAA’s official forecast provides probabilities for strength categories and does not confirm a guaranteed peak of +3.6°C.
What could El Niño mean for the United States?
It may strengthen the southern storm track, raising the probability of wetter conditions from California and the Southwest toward the Gulf Coast and Southeast. Northern areas may lean milder, although Arctic outbreaks remain possible.
What could El Niño mean for Europe?
Europe’s response is less direct. A strong event may influence Atlantic storm tracks, winter rainfall and the Polar Vortex, but the North Atlantic Oscillation and high-latitude blocking will be equally important.
Will the Atlantic hurricane season be quiet?
NOAA favors a below-normal Atlantic season, with 8–14 named storms, 3–6 hurricanes and 1–3 major hurricanes. However, seasonal activity does not predict where or whether a damaging landfall will occur.
Could 2027 become the warmest year on record?
Yes. The WMO says the expected El Niño increases that possibility. However, the chance of an individual year exceeding 2°C above the pre-industrial level remains below 1%.
NOAA OISST data for the most recent two weeks are preliminary and may be revised. Seasonal outlooks describe probabilities and broad shifts in risk; they do not predict the exact dates or locations of future storms, droughts, floods, cold waves or snow events.
The Founder and Chief Meteorologist at Pogodnik.com. With over 15 years of operational experience in synoptic analysis and climate forecasting, he specializes in storm tracking, magnetic storms, and atmospheric dynamics. A recognized expert in Ukraine’s meteorological sector, he maintains strategic collaborations with global agencies, including NOAA and ECMWF, to ensure high-precision data integration. His analytical reviews and scientific contributions are regularly featured in leading media outlets dedicated to weather science and environmental trends.