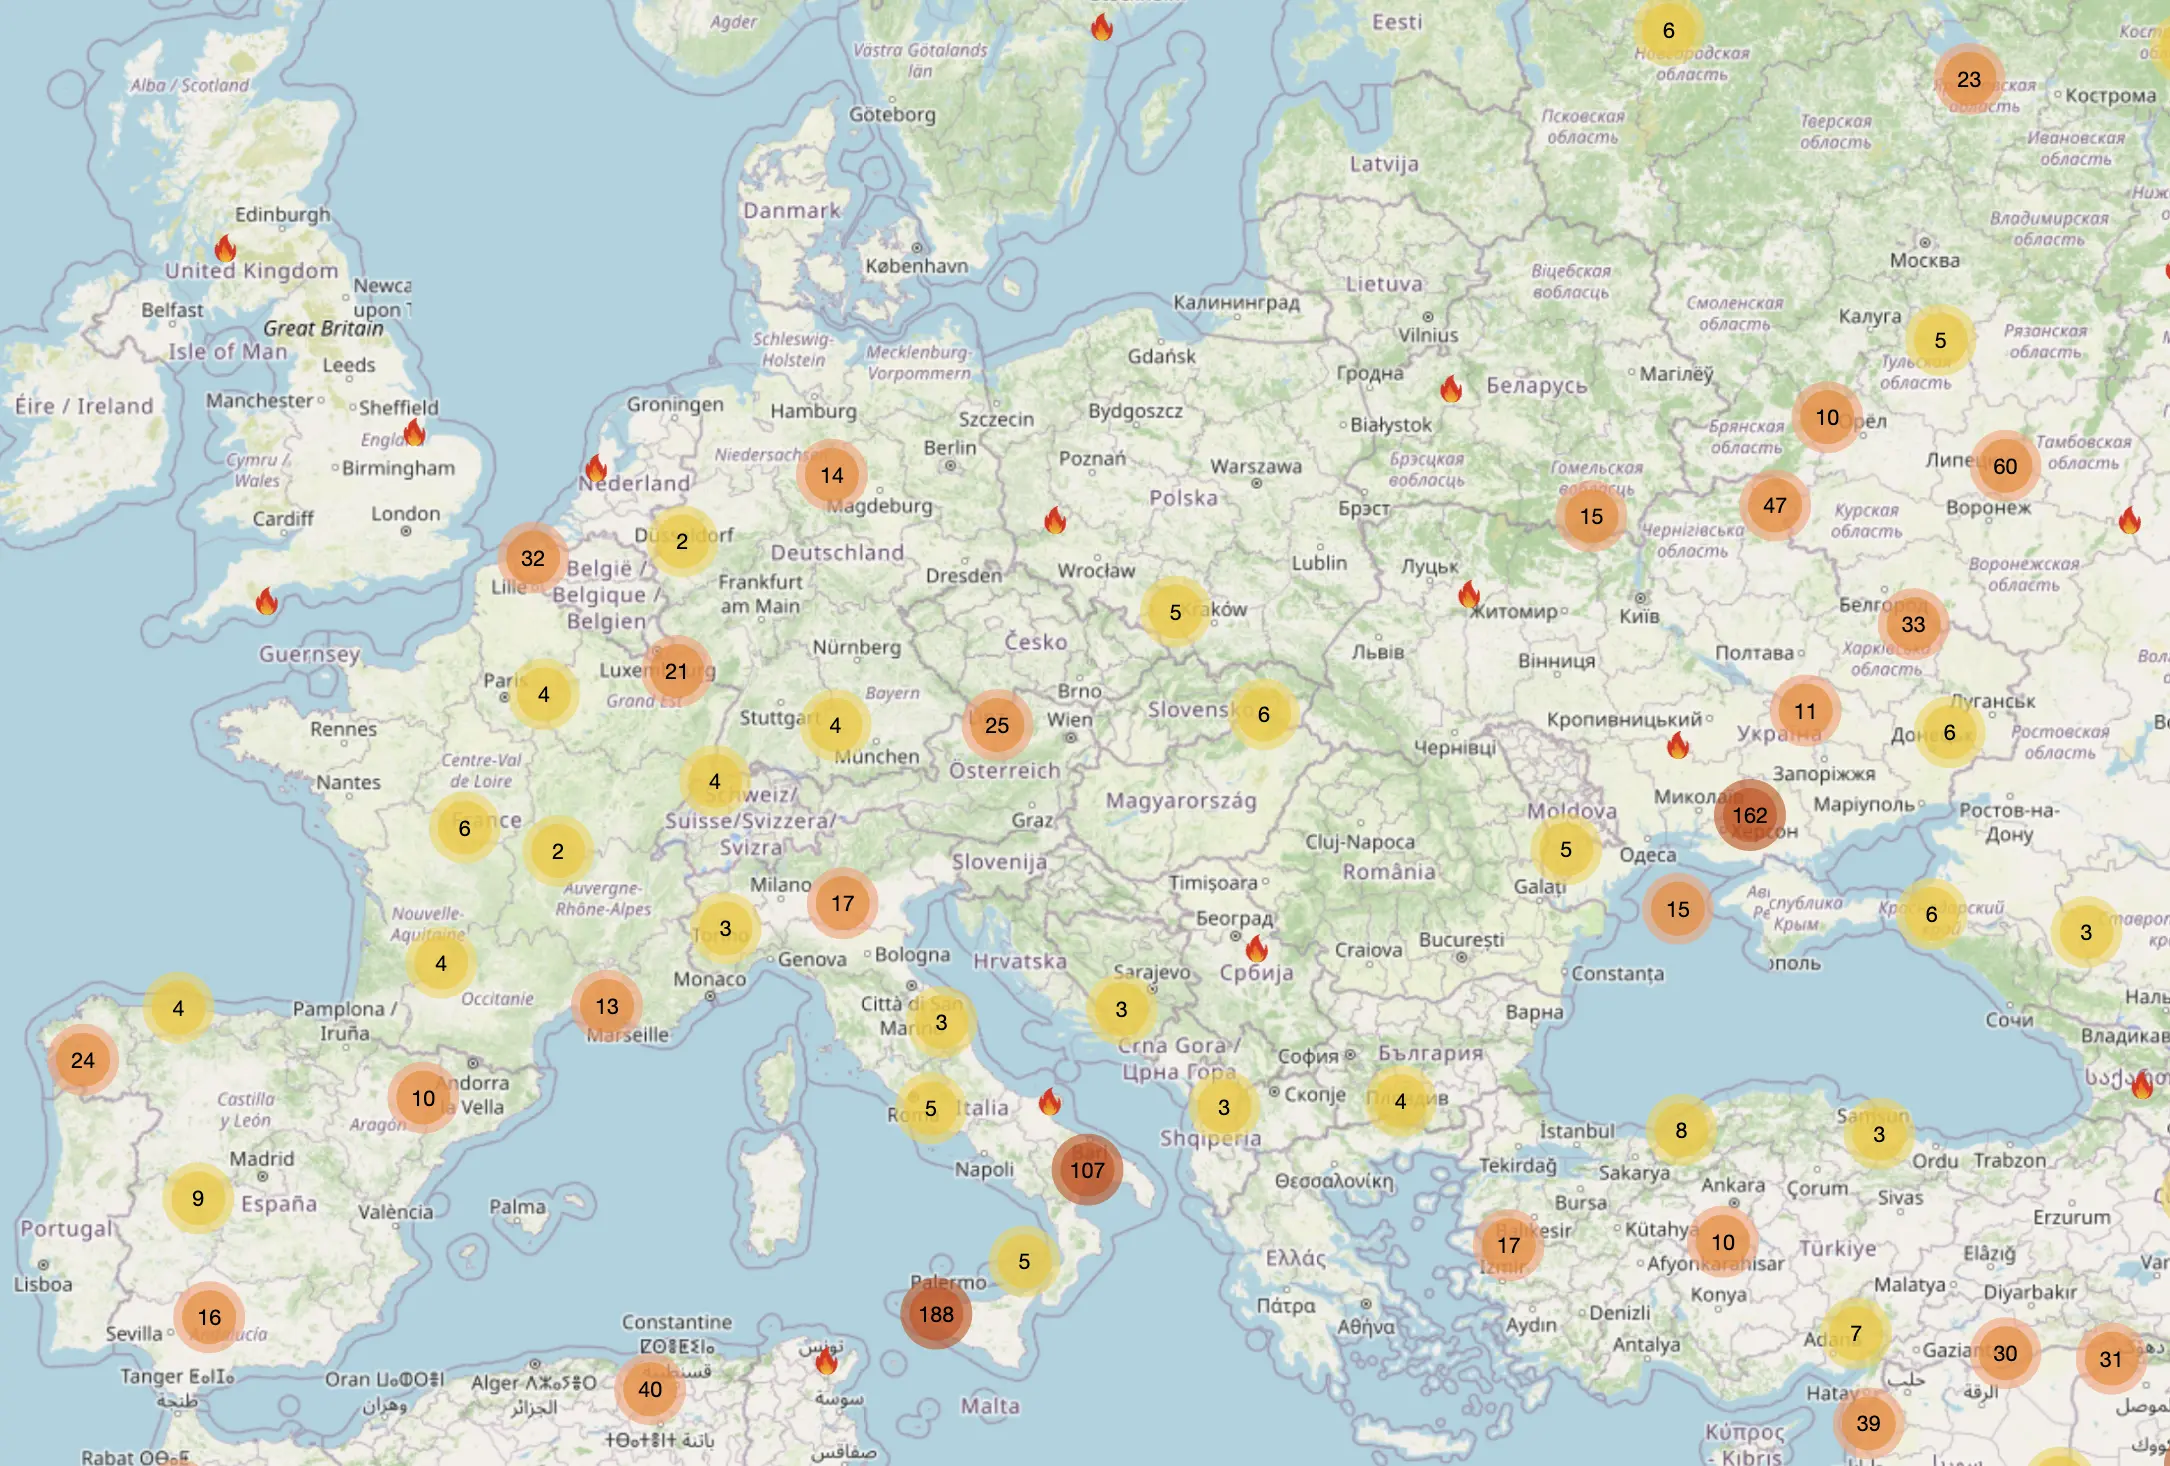
Coronavirus map Online. The Online map presents detailed statistics by country and region.
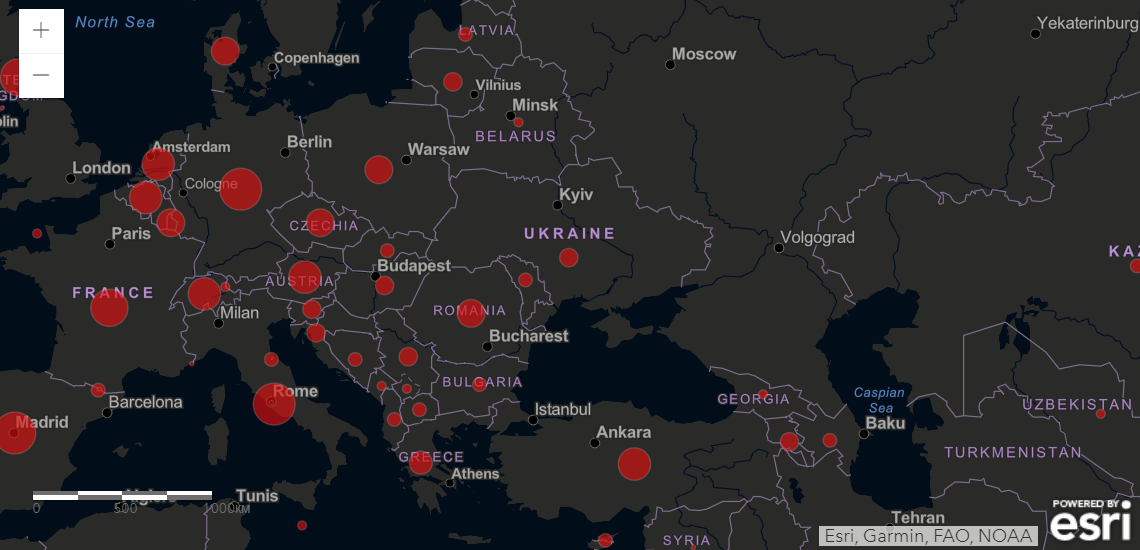
You can monitor the spread of coronavirus throughout the planet in real time using the infection map for countries and cities, which is available to everyone on the Pogodnik website.
This interactive map, embedded via an iframe from coronavirus.app, provides a comprehensive and real-time overview of the global COVID-19 situation. It is a valuable resource for staying informed about the spread of the coronavirus, helping individuals, organizations, and health professionals monitor developments as they happen.
The map presents detailed statistics by country and region, including the number of confirmed cases, recoveries, and deaths. It visually represents these figures through color-coded markers, making it easy to identify hotspots and track patterns of infection across the globe. This visual approach enhances understanding and allows for a quicker grasp of complex data.
What sets this tool apart is its live updating capability. The data is continuously refreshed from reliable sources such as the World Health Organization (WHO), Centers for Disease Control and Prevention (CDC), and official government health departments. Users can explore the map by zooming in and out or clicking on specific countries and regions to view localized statistics.
This embedded map is especially useful for websites aiming to inform their audiences about global health trends or for educational purposes. It requires no additional setup and is fully responsive, meaning it adjusts smoothly across different screen sizes—from desktops to mobile devices.
By including this live map on a webpage, site owners can contribute to public awareness and promote data transparency during the ongoing pandemic. Whether you are an educator, blogger, or organization, this simple yet powerful tool can help you deliver timely and relevant health information.
Thanks to the update of the service in real time, the most current data is available to users of the site. Locations of distribution are indicated by red dots on the map. There is also data on the number of confirmed cases of disease, deaths and cases of recovery.
The pathway of the coronavirus infection that the country is moving along is shown in the graph. Also on the graph you can see a decrease in the propagation rate of COVID-19. It should be noted that on it there are only those states in which more than 100 cases of infection are recorded.
Due to the varying intensities of testing coronavirus in different countries, the data displayed on the map may not be complete.
Coronavirus has spread to all countries. The infected are recorded even in the most remote parts of the land.